The normal PV circulation is demonstrated in Fig. 2.
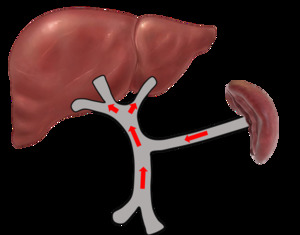
Fig. 2: Normal portal venous circulation
References: Sim Wanjou, 2019
Normal portal vein waveform
Sonographically,
PV has a thick and echogenic wall.
It demonstrates antegrade flow direction (hepatopetal flow).
The normal PV waveform is described as phasic,
with minimal or gentle undulation depending on the cardiac cycle and respiration [3].
The flow velocity ranges from 16 to 40cm/sec [3-4] (Fig. 3).
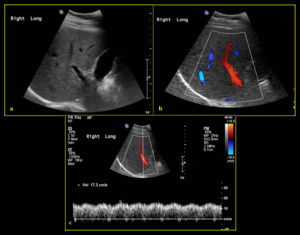
Fig. 3: Normal portal vein (a) B-mode ultrasound shows normal appearance of right portal vein with anechoic lumen (b) Colour Doppler demonstrates normal hepatopetal flow (c) Spectral Doppler reveals normal portal vein waveform with mild undulation and normal velocity (17.2 cm/sec).
References: Division of Rad Science, Singapore General Hospital, 2019
Abnormal portal vein waveform
Different pathologies may affect the appearance and waveforms in a unique way.
A good grasp of the concepts and principles behind may aid in identifying the specific pathology.
- Pulsatile portal venous flow
Pulsatile PV flow can be physiological or pathological.
The degree of undulation may vary and can be measured using the pulsatility index (PI) [3-4],
which is calculated as V2/V1 with V1 representing peak portal velocity during systole and V2 representing trough velocity during diastole [3].
Pulsatile PV waveform happens when there is a large difference between the peak systolic and end diastolic velocities with PI > 0.5 [3].
As hepatic sinusoids connect PV with hepatic veins and arteries (Fig. 1) [3],
PI increases when increased pressure is abnormally transmitted across the hepatic sinusoids [4].
The pulsatile PV waveform may resemble an inverted hepatic venous waveform [3].
Fig. 4 categorises the causes of pulsatile PV waveform based on hepatic venous (Fig. 6 & Fig. 7) and arterial related (Fig. 8 & Fig. 9).
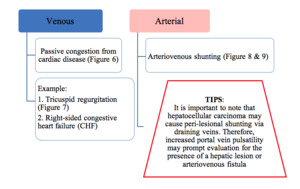
Fig. 4: Classification of the underlying causes of pulsatile portal venous waveform
References: Chamarthi et al., 2013
Clinically,
it is not difficult to differentiate the cause of increased pulsatility.
Heart disease such as tricuspid regurgitation and right-sided congestive heart failure are often associated with dilated hepatic veins whereas in liver cirrhosis,
hepatic veins appear compressed on grey-scale ultrasound [3-4].
However,
pulsatile PV waveform without retrograde flow may also be seen in healthy group especially thin patient [5]. Fig. 5 demonstrates the mechanism of normal PV waveform among healthy population while Fig. 6 and Fig. 8 demonstrate mechanism of pulsatile PV waveform among pathologic populations.
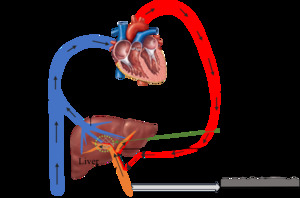
Fig. 5: Mechanism of normal portal venous waveform under normal blood circulation among healthy group
References: Sim Wanjou, 2019
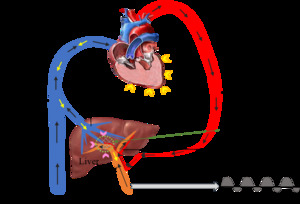
Fig. 6: Mechanism of increased portal venous waveform pulsatility in a background of congestive heart disease. Hepatic venous pulsatility is partially transmitted to the portal veins via the hepatic sinusoids (pink arrowhead), which results in cardiac variability in portal venous waveform and hence pulsatility [3]
References: Sim Wanjou, 2019
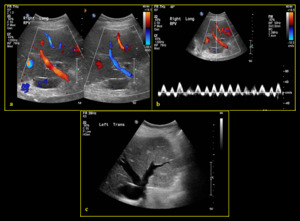
Fig. 7: 84-year-old male with history of tricuspid regurgitation (a) Colour Doppler demonstrates mixture of flow in both red and blue (hepatopetal & hepatofugal). (b) Spectral Doppler demonstrates waveform above and below baseline (PI >1) indicating waveform pulsatility. (c) B-mode image demonstrates prominent hepatic veins due to background of cardiac disease.
References: Division of Rad Science, Singapore General Hospital, 2019
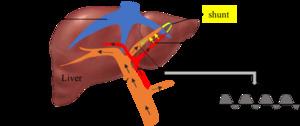
Fig. 8: Mechanism of increased portal venous waveform pulsatility in the presence of arterioportal shunt. Hepatic arterial pressure is abnormally transmitted to the portal veins (yellow arrow) and hence affects the portal venous waveform pulsatility.
References: Sim Wanjou, 2019
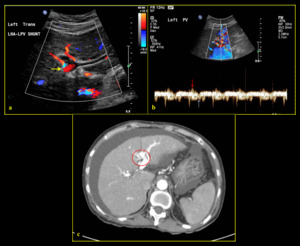
Fig. 9: 65-year-old female with congenital arterioportal shunt. (a) Colour Doppler depicts shunting between left intrahepatic artery and left portal vein (yellow arrow). (b) Spectral Doppler demonstrates pulsatile waveform above (red arrow) and below (blue arrow) the baseline (PI >1) indicating waveform pulsatility. (c) Finding was confirmed on CT axial plane where the portal vein is seen enhanced during arterial phase (red circle).
References: Division of Rad Science, Singapore General Hospital, 2019
- Sluggish or slow portal venous flow
Slow PV flow is diagnosed when the peak velocity is less than 16cm/sec [6] (Fig. 10).
It happens when increased back pressure due to liver fibrosis limits the forward portal velocity [4].
It is often resulted from portal hypertension caused by liver cirrhosis [3].
In addition,
worsening of portal hypertension may lead to increase development of PV thrombosis due to the flow stasis [6].
Technically,
colour scale should be reduced for better depiction of colour flow.
Choice of Doppler frequency may also affect the velocity measurement.
High frequency is favoured for a more accurate velocity measurement,
compared with low frequency that allows better penetration.
Doppler angle should be kept less than 60° [7].
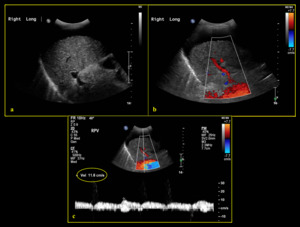
Fig. 10: 81-year-old female with Child’s C liver cirrhosis, portal hypertension and gross ascites. (a) B-mode sonogram demonstrates normal anechoic right portal vein. (b) Colour Doppler shows hepatopetal flow with no obvious filling defect. (c) Spectral Doppler demonstrates reduced velocity (slow flow) of the portal vein at 11.6cm/sec.
References: Division of Rad Science, Singapore General Hospital, 2019
- Reversed portal venous flow
Hepatofugal flow occur when the back pressure exceeds the forward pressure in the lumen.
On Doppler imaging,
the waveform will be seen below the baseline [3-4] (Fig. 12, Fig. 13).
The most common cause of hepatofugal flow is portal hypertension.
In severe liver cirrhosis,
hepatic venules and sinusoids are obstructed by fibrosis,
resulting in reversed flow [7].
Hepatofugal flow may occur in isolated intrahepatic PV branches when the liver is not equally affected by disease [8].
Fig. 11 describes mechanism of reversed PV flow in background of portal hypertension.
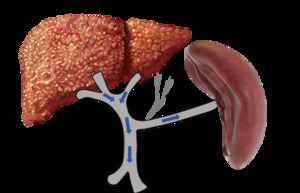
Fig. 11: Mechanism of reversed (hepatofugal) flow (blue arrow) in background of severe liver fibrosis with portal hypertension and associated splenomegaly from increased inflow to the spleen. In some cases, varices may occur to alleviate the portal pressure (eg: oesophageal varices, perisplenic varices, abdominal wall varices etc).
Black arrows: back pressure
References: Sim Wanjou, 2019
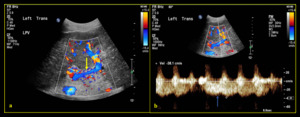
Fig. 12: 88-year-old female with liver cirrhosis and associated portal hypertension (a) Colour Doppler shows reversed (hepatofugal) flow of the left portal vein (yellow arrow). (b) Spectral Doppler demonstrates waveform below the baseline (blue arrow) (Note: waveform above the baseline represent artifact from the adjacent arteries due to respiration).
References: Division of Rad Science, Singapore General Hospital, 2019
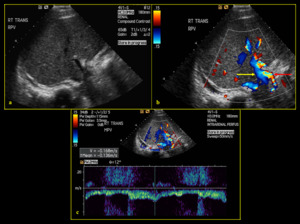
Fig. 13: 33-year-old male with history of acute myeloid leukemia (AML) post bone marrow transplant, presenting with ascites and suspected portal hypertension due to hepatic veno-occlusive disease. (a) B-mode image shows narrowing of portal vein calibre. (b) Colour Doppler demonstrates reversal of portal vein flow in the hepatofugal direction (yellow arrow) with compensatory hypertrophy of the hepatic artery (red arrow). (c) Spectral Doppler reveals waveform below the baseline at 16.8cm/sec.
References: Division of Rad Science, Singapore General Hospital, 2019
- Absent portal venous flow
Absence of PV flow may be seen in occlusive diseases or hypercoagulable states which increase the risk for thrombosis [3-4].
However,
absence of flow is not an indication of occlusive diseases [3].
In severe portal hypertension with a background of severe liver fibrosis,
the PV flow may be stagnant whereby it is neither hepatopetal nor hepatofugal [3,
6].
No PV waveform will be seen under spectral Doppler.
Portal vein thrombosis (PVT):
PVT may refer to partial or total occlusion of the PV with the presence of thrombus within the lumen,
causing filling defect on colour Doppler.
It may be classified into acute or chronic depending on the duration of thrombosis.
Sonographically,
PVT may be seen as hyperechoic material with the lumen,
causing absent of colour flow.
It often occurs in the setting of liver cirrhosis with background of portal hypertension.
Presence of collateral vessels is common due to cavernous transformation [7].
It is important to distinguish between benign (bland) (Fig. 14, Fig. 15) and malignant (tumour) (Fig. 16, Fig. 17) PVT as it affects patient’s prognosis and management.
Ultrasound imaging can be helpful (Table 1).
Table 1:
|
|
Bland PVT
|
Tumour PVT
|
|
Grey scale
|
Normal echogenic wall is preserved.
|
Expanded vein calibre with loss of wall definition
|
|
Colour Doppler
|
Absence of vascularity within the thrombus
|
Presence of vascularity within thrombus with “thread and streak sign”
|
|
Spectral Doppler
|
Spectral Doppler shows absent waveform in total occlusive PVT.
Normal portal venous waveform is likely seen,
if the thrombus is not totally occlusive
|
Spectral Doppler shows arterialised or pulsatile waveform
|
|
Associated finding
|
Absence of liver mass
|
Presence/absence of liver mass
|
[7]
However,
it is important to note that tumour thrombus may also be seen in the setting of normal portal vein calibre and bland thrombus may sometimes expand the portal vein in acute setting [3].
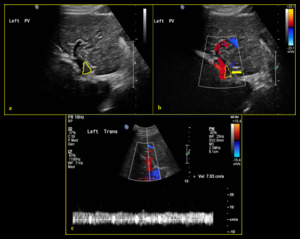
Fig. 14: 69-year-old male with history of liver cirrhosis and chronic partial bland portal vein thrombosis. (a) B-mode ultrasound shows partial echogenic material within the left portal vein lumen (yellow line) with filling defect on colour Doppler (b) (yellow line & yellow arrow). (Note: colour scale should be reduced for better depiction of colour flow looking at background of liver cirrhosis with possible portal hypertension). (c) Spectral Doppler illustrates minimally undulated portal venous flow at reduced velocity of 7.0 cm/sec.
References: Division of Rad Science, Singapore General Hospital, 2019
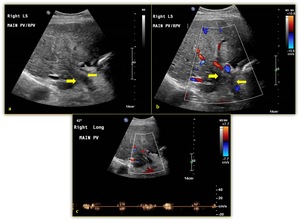
Fig. 15: 80-year-old female with history of liver cirrhosis and occluded bland portal vein thrombosis. (a) B-mode image shows echogenic material within the portal vein, corresponding to thrombus (yellow arrow). There is no obvious dilatation of portal vein caliber with preserved wall definition. (b) Colour Doppler shows absent of flow within portal vein lumen (yellow arrow). (c) Spectral Doppler demonstrates no true portal venous flow.
References: Division of Rad Science, Singapore General Hospital, 2019
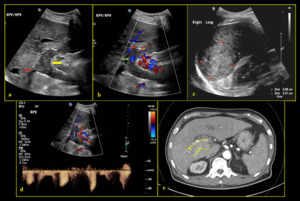
Fig. 16: 67-year-old male with multiple liver mass (hepatocellular carcinoma) and malignant (tumour) portal vein thrombosis. (a) B-mode sonogram shows echogenic material within the right and main portal veins (yellow arrow) associated with expanded lumen and loss of wall definition (red arrow). (b) Colour Doppler shows absent PV flow, corresponding to occlusive PV thrombus. Minimal vascularity (green arrow) noted within the echogenic material. (c) Liver masses noted with the largest measuring up to 5.6cm. (d) Spectral Doppler demonstrates arterialised waveform. (e) CT axial plane arterial phase shows arterial enhancement within the thrombus (yellow arrowhead), corresponding to tumour thrombosis.
References: Division of Rad Science, Singapore General Hospital, 2019
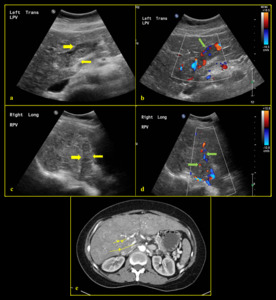
Fig. 17: 59-year-old male with portal vein thrombosis (malignant thrombus) (a, c) B-mode images show echogenic material (yellow arrow) within the distended right and left portal veins with loss of wall definition. (b, d) Colour Doppler images show vascularity within the echogenic thrombus (green arrow). (e) CT axial plane arterial phase shows arterial enhancement within the thrombus (yellow arrowhead), corresponding to tumour thrombosis.
References: Division of Rad Science, Singapore General Hospital, 2019
PV gas is the presence of gas in the PV and its branches.
It is usually seen as mobile echogenic foci within the PV lumen.
Spectral Doppler may displays sharp bidirectional spikes on both sides of the baseline (Fig. 18).
It may be seen in sinister disease such as bowel necrosis/infarct,
intraabdominal abscess,
intestinal obstruction or sepsis.
It may also be a common finding in early postoperative period [9].
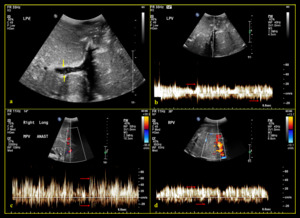
Fig. 18: 27-year-old female with bowel ischemia after living donor liver transplantation with left lobe graft (a) B-mode image shows some mobile echogenic foci (yellow arrow) within the left portal vein lumen. (b, c, d) Spectral Doppler shows bidirectional spikes (red arrow) corresponding to portal venous air.
References: Division of Rad Science, Singapore General Hospital, 2019
- Portal vein stenosis (PVS)
PVS is the most common complication post liver transplantation.
It is more common in living donor liver transplant (LDLT),
occurring at the anastomotic site. Risk factors for PVS include vessel size discrepancies [10],
clamp injuries and previous portal vein surgery.
Sonographically,
it is seen as narrowing of lumen on grey scale ultrasound with focal colour aliasing on colour Doppler.
Spectral Doppler may reveals velocity of more than 125cm/s with three to four times increase in velocity at the stenotic point relative to the pre-stenotic segment [11] (Fig. 19).
Most cases with certain degree of PVS are asymptomatic.
Severe PVS may lead to complication such as portal hypertension with gastrointestinal bleeding,
splenomegaly with pancytopenia,
and/or PV thrombosis [12].
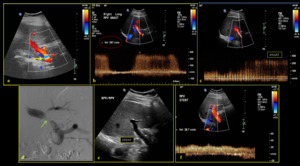
Fig. 19: 68-year-old female presented with abnormal liver function test one month post cadaveric liver transplant. (a) Colour Doppler shows colour aliasing (yellow arrow) at the site of narrowing. (b) Spectral Doppler shows increased velocity of 297 cm/sec. (c) Spectral Doppler reveals approximately three times increase in velocity at the stenotic point relative to the pre-stenotic segment (d) Finding was proven on angiography (green arrow). (e) An echogenic linear stent was inserted across the narrowed anastomotic site. (f) Post stenting spectral waveform shows normal velocity.
References: Division of Rad Science, Singapore General Hospital, 2019
It is commonly seen post liver transplant due difference in PV diameter between donor and native vessels.
It is significant when the discrepancy in diameter is more than 50%.
Helical flow is described as minor flow superimposed on the primary flow caused by disturbance in the laminar flow [7],
which happens due to changes in viscosity,
vessel geometry,
flow direction and speed [13].
It will be seen as alternating red and blue band with spiral-like pattern,
and normally seen at the level of calibre change [7] (Fig. 20).
Helical flow within PV normally resolves shortly after the operation.
However,
if the helical flow persists,
it may result in increased PV velocity and result in portal vein stenosis [7].
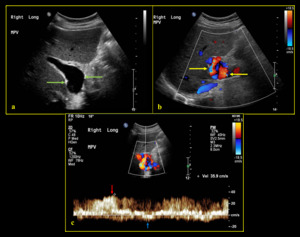
Fig. 20: 55-year-old male post liver transplantation with a right liver graft. (a) B-mode image shows post-anastomotic dilatation of the main portal vein (green arrow). (b) Colour Doppler demonstrates helical flow (yellow arrow) with alternating red and blue band with spiral-like pattern at the dilatation site. (c) Spectral Doppler reveals portal venous waveform above (red arrow) and below (blue arrow) the baseline.
References: Division of Rad Science, Singapore General Hospital, 2019


 B-mode ultrasound shows normal appearance of right portal vein with anechoic lumen (b) Colour Doppler demonstrates normal hepatopetal flow (c) Spectral Doppler reveals normal portal vein waveform with mild undulation and normal velocity (17.2 cm/sec). References: Division of Rad Science, Singapore General Hospital, 2019")

, which results in cardiac variability in portal venous waveform and hence pulsatility [3] References: Sim Wanjou, 2019")
 Colour Doppler demonstrates mixture of flow in both red and blue (hepatopetal & hepatofugal). (b) Spectral Doppler demonstrates waveform above and below baseline (PI >1) indicating waveform pulsatility. (c) B-mode image demonstrates prominent hepatic veins due to background of cardiac disease. References: Division of Rad Science, Singapore General Hospital, 2019")
 and hence affects the portal venous waveform pulsatility. References: Sim Wanjou, 2019")
 Colour Doppler depicts shunting between left intrahepatic artery and left portal vein (yellow arrow). (b) Spectral Doppler demonstrates pulsatile waveform above (red arrow) and below (blue arrow) the baseline (PI >1) indicating waveform pulsatility. (c) Finding was confirmed on CT axial plane where the portal vein is seen enhanced during arterial phase (red circle). References: Division of Rad Science, Singapore General Hospital, 2019")
 B-mode sonogram demonstrates normal anechoic right portal vein. (b) Colour Doppler shows hepatopetal flow with no obvious filling defect. (c) Spectral Doppler demonstrates reduced velocity (slow flow) of the portal vein at 11.6cm/sec. References: Division of Rad Science, Singapore General Hospital, 2019")
 flow (blue arrow) in background of severe liver fibrosis with portal hypertension and associated splenomegaly from increased inflow to the spleen. In some cases, varices may occur to alleviate the portal pressure (eg: oesophageal varices, perisplenic varices, abdominal wall varices etc).
Black arrows: back pressure References: Sim Wanjou, 2019")
 Colour Doppler shows reversed (hepatofugal) flow of the left portal vein (yellow arrow). (b) Spectral Doppler demonstrates waveform below the baseline (blue arrow) (Note: waveform above the baseline represent artifact from the adjacent arteries due to respiration). References: Division of Rad Science, Singapore General Hospital, 2019")
 post bone marrow transplant, presenting with ascites and suspected portal hypertension due to hepatic veno-occlusive disease. (a) B-mode image shows narrowing of portal vein calibre. (b) Colour Doppler demonstrates reversal of portal vein flow in the hepatofugal direction (yellow arrow) with compensatory hypertrophy of the hepatic artery (red arrow). (c) Spectral Doppler reveals waveform below the baseline at 16.8cm/sec. References: Division of Rad Science, Singapore General Hospital, 2019")
 B-mode ultrasound shows partial echogenic material within the left portal vein lumen (yellow line) with filling defect on colour Doppler (b) (yellow line & yellow arrow). (Note: colour scale should be reduced for better depiction of colour flow looking at background of liver cirrhosis with possible portal hypertension). (c) Spectral Doppler illustrates minimally undulated portal venous flow at reduced velocity of 7.0 cm/sec. References: Division of Rad Science, Singapore General Hospital, 2019")
 B-mode image shows echogenic material within the portal vein, corresponding to thrombus (yellow arrow). There is no obvious dilatation of portal vein caliber with preserved wall definition. (b) Colour Doppler shows absent of flow within portal vein lumen (yellow arrow). (c) Spectral Doppler demonstrates no true portal venous flow. References: Division of Rad Science, Singapore General Hospital, 2019")
 and malignant (tumour) portal vein thrombosis. (a) B-mode sonogram shows echogenic material within the right and main portal veins (yellow arrow) associated with expanded lumen and loss of wall definition (red arrow). (b) Colour Doppler shows absent PV flow, corresponding to occlusive PV thrombus. Minimal vascularity (green arrow) noted within the echogenic material. (c) Liver masses noted with the largest measuring up to 5.6cm. (d) Spectral Doppler demonstrates arterialised waveform. (e) CT axial plane arterial phase shows arterial enhancement within the thrombus (yellow arrowhead), corresponding to tumour thrombosis. References: Division of Rad Science, Singapore General Hospital, 2019")
 (a, c) B-mode images show echogenic material (yellow arrow) within the distended right and left portal veins with loss of wall definition. (b, d) Colour Doppler images show vascularity within the echogenic thrombus (green arrow). (e) CT axial plane arterial phase shows arterial enhancement within the thrombus (yellow arrowhead), corresponding to tumour thrombosis. References: Division of Rad Science, Singapore General Hospital, 2019")
 B-mode image shows some mobile echogenic foci (yellow arrow) within the left portal vein lumen. (b, c, d) Spectral Doppler shows bidirectional spikes (red arrow) corresponding to portal venous air. References: Division of Rad Science, Singapore General Hospital, 2019")
 Colour Doppler shows colour aliasing (yellow arrow) at the site of narrowing. (b) Spectral Doppler shows increased velocity of 297 cm/sec. (c) Spectral Doppler reveals approximately three times increase in velocity at the stenotic point relative to the pre-stenotic segment (d) Finding was proven on angiography (green arrow). (e) An echogenic linear stent was inserted across the narrowed anastomotic site. (f) Post stenting spectral waveform shows normal velocity. References: Division of Rad Science, Singapore General Hospital, 2019")
 B-mode image shows post-anastomotic dilatation of the main portal vein (green arrow). (b) Colour Doppler demonstrates helical flow (yellow arrow) with alternating red and blue band with spiral-like pattern at the dilatation site. (c) Spectral Doppler reveals portal venous waveform above (red arrow) and below (blue arrow) the baseline. References: Division of Rad Science, Singapore General Hospital, 2019")