Classical Imaging appearances using various modalities such as X-RAY skull,
CT,MRI are discussed.
LEMON SIGN:
The lemon sign,
is the shape of the skull resembling a lemon due to indentation of the frontal bone.
It is classically seen as a sign of Chiari II malformation and also seen in the majority (90-98%) of foetuses with spina bifida.
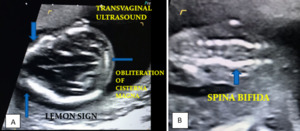
Fig. 1: Figure 1A & B: LEMON SIGN: Axial imaging of foetal brain at 14 weeks 6 days shows indentation of frontal bones (depicting a lemon), suggestive of Open spina bifida with cranial signs of herniation of posterior fossa contents of brain. (ARNOLD CHIARI MALFORMATION TYPE II)
References: "Department of Radiology,Shri Sathya Sai Medical College and Research Institute/Chennai/2018"
PUFF OF SMOKE APPEARANCE:
Moyamoya,
the Japanese term for “puff of smoke,” refers to progressive stenosis/occlusion of the distal ICAs and proximal ACAs/MCAs with relative sparing of the posterior circulation.
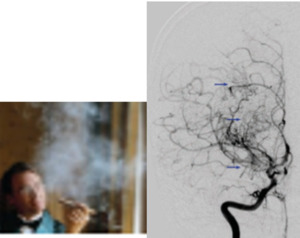
Fig. 2: Right ICA angiogram, AP projection, shows stenosis of the supra clinoid ICA, A1, and M1 segments with multiple lenticulostriate collaterals (arrows).Suggestive of moya moya disease.
References: Ortiz-Neira CL. The puff of smoke sign. Radiology. 2008;247(3):910-911
BAG OF WORMS APPEARANCE:
Arteriovenous malformation is a high-flow vascular malformation characterized by abnormal arteriovenous shunting without an intervening capillary bed.
At imaging,
the nidus has a tortuous “bag of worms” appearance,
with early arterial enhancement and venous drainage.
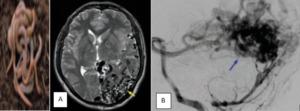
Fig. 3: Axial T2-weighted MR shows multiple serpiginous flow voids centred in the left temporal and occipital lobes (yellow arrow), with associated mass effect. Left vertebral artery angiogram, lateral projection, identifies the large nidus (blue arrow), with early arterial enhancement and superficial venous drainage. Suggestive of AVM
References: Geibprasert S, Pongpech S, Jiarakongmun P, et al. Radiologic assessment of brain arteriovenous malformations: what clinicians need to know. Radiographics. 2010;30(2):483-501.
DIAGNOSIS: Arteriovenous malformation
INCOMPLETE RING SIGN:
Half of tumefactive demyelinating lesions demonstrate pathologic enhancement.
“Incomplete ring” enhancement is a specific sign,
helping to distinguish active demyelination (particularly multiple sclerosis) from infectious and neoplastic etiologies.

Fig. 4: Enhanced axial T1-weighted spin-echo image reveals incomplete ring of enhancement which is open on gray matter side.
References: Mai-Lan Ho, MD, Ronald L. Eisenberg, MD, JD,2014, Textbook of Neuro Radiology signs, United States, McGraw-Hill Education.
DIFFERENTIAL DIAGNOSIS:
• Demyelinating disease
• Primary tumor
• Lymphoma
BOX CAR VENTRICLES
In Huntington disease imaging shows selective atrophy of the basal ganglia,
particularly the caudate nuclei.
This produces characteristic squaring of the frontal horns (“boxcar ventricles”).
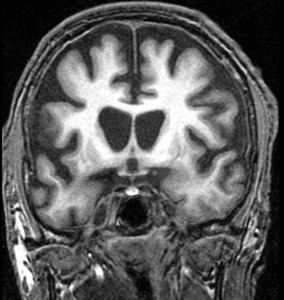
Fig. 5: Coronal FLAIR MR shows atrophy of the caudate nuclei (arrows) with resulting enlargement and squaring of the frontal horns.
References: Mai-Lan Ho, MD, Ronald L. Eisenberg, MD, JD,2014, Textbook of Neuro Radiology signs, United States, McGraw-Hill Education.
DIFFERENTIAL DIAGNOSIS:
• Huntington disease
• Other neurodegenerative disorders
SOAP BUBBLE APPEARANCE:
Central neurocytomas and oligodendrogliomas have a similar histological and imaging appearance with T2-hyperintense multilocular “bubbly” contents,
variable enhancement,
and calcification.
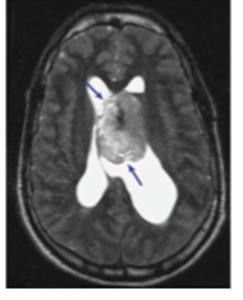
Fig. 6: Axial T2-weighted MR shows a multilocular lesion (arrows) in the left lateral ventricle attached to the septum pellucidum.
References: Koeller KK, Rushing EJ. From the archives of the AFIP: Oligodendroglioma and its variants: radiologicpathologic correlation. Radiographics. 2005;25(6):1669-1688.
DIFFERENTIAL DIAGNOSIS:
• Central neurocytoma
• Oligodendroglioma
BUTTERFLY APPEARANCE:
“Butterfly” lesions involve both cerebral hemispheres and the intervening corpus callosum.
Seen in aggressive lesions such as glioblastoma multiforme (GBM),
CNS lymphoma,
and tumefactive multiple sclerosis.

Fig. 7: Coronal contrast-enhanced T1-weighted MR shows a peripherally enhancing bifrontal mass extending through the corpus callosum (arrow).
References: Ho ML, Moonis G, Ginat DT, Eisenberg RL. Lesions of the corpus callosum. AJR Am J Roentgenol. 2013;200(1):W1-W16.
DIFFERENTIAL DIAGNOSIS:
• Glioblastoma multiforme
• Lymphoma
CORDUROY,
STRIATED,
TIGROID APPEARANCE:
Lhermitte-Duclos disease (dysplastic cerebellar gangliocytoma) is a rare hamartomatous lesion of the cerebellum that is characterized by hypertrophy of the stratum granulosum.
This results in characteristic disorganization and enlargement of the cerebellar folia,
which appear T2-hyperintense to isointense and T1-hypointense to isointense (“corduroy” sign)
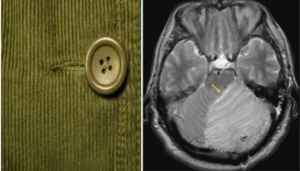
Fig. 8: Axial T2-weighted MR shows expanded cerebellar folia with alternating hyperintense and hypo intense bands in the left cerebellar hemisphere and vermis (arrow).
References: Meltzer CC, Smirniotopoulos JG, Jones RV. The striated cerebellum: an MR imaging sign in LhermitteDuclos disease (dysplastic gangliocytoma). Radiology. 1995;194(3):699-703.
DIAGNOSIS: Lhermitte-Duclos disease
CORTICAL RIBBON SIGN:
Cortical gray matter is eight times more metabolically active than the white matter,
and is thus highly susceptible to injury from a number of causes.
On MR,
hyperintense cortical signal on T2-weighted and DWI sequences (“cortical ribbon”) can be seen with various etiologies.
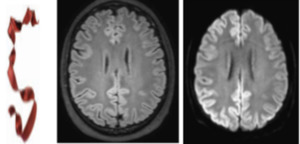
Fig. 9: Axial FLAIR and DWI MR show hyperintense signal throughout the cerebral cortex.
References: Sheerin F, Pretorius PM, Briley D, et al. Differential diagnosis of restricted diffusion confined to the cerebral cortex. Clin Radiol. 2008;63(11):1245-1253.
DIFFERENTIAL DIAGNOSIS:
•Hypoxic-ischemic injury
•Creutzfeldt-Jakob disease
•Meningoencephalitis
• Metabolic disorders
• Postictal state
HOT CROSS BUN SIGN:
Seen in Multiple system atrophy.
MSA-C (cerebellar type) shows selective atrophy of the pons,
cerebellum,
and middle cerebellar peduncles.
The “cruciform” appearance of the pons results from neuronal degeneration in the pontine raphe and transverse pontocerebellar fibers,
with preservation of the pontine tegmentum and corticospinal tracts.
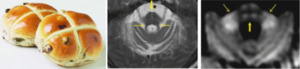
Fig. 10: Axial T2-weighted MR shows pontine and cerebellar atrophy with a cruciform appearance (thick arrow). The brachia conjunctivum (thin arrows) are preserved. • Axial DWI MR shows atrophy and increased signal in the pons (thick arrow) and brachia pontis (thin arrows). The fourth ventricle is dilated.
References: Huang YP, Tuason MY, Wu T, et al. MRI and CT features of cerebellar degeneration. J Formos Med Assoc. 1993;92(6):494-508. Shrivastava A. The hot cross bun sign. Radiology. 2007;245(2):606-607.
DIAGNOSIS: Multiple system atrophy,
cerebellar subtype.
CSF CLEFT SIGN:
Extraaxial masses frequently demonstrate a rim of high T2 signal that separates them from subjacent brain.
This has been proposed to represent intervening cerebrospinal fluid (“CSF cleft”),
dura,
vessels,
and/or tumor capsule
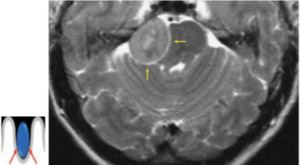
Fig. 11: Axial T2-weighted MR shows a right cerebellopontine angle mass with surrounding T2-hyperintense rim (arrows). The right pons and brachium conjunctivum are compressed and displaced away from the mass.
References: Brant WE, Helms C. Fundamentals of Diagnostic Radiology, 3rd ed. Baltimore: Lippincott Williams and Wilkins, 2012. Takeguchi T, Miki H, Shimizu T, et al. Evaluation of the tumor-brain interface of intracranial meningiomas on MR imaging including FLAIR images. Magn Reson Med Sci. 2003;2(4):165-169.
DIAGNOSIS: Extra axial mass (meningioma)
CYST WITH DOT SIGN:
Neurocysticercosis is a neurologic disease caused by the pork tapeworm Taenia solium.
Vesicular neurocysticercosis demonstrates parenchymal a with associated scolices (larval hexacanth and head,
forming the “cyst with dot” appearance) and little or no edema.
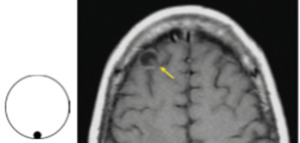
Fig. 12: Axial contrast-enhanced T1weighted MR shows a right frontal cystic lesion with enhancing rim and punctate internal focus (arrow).
References: Kimura-Hayama ET, Higuera JA, Corona-Cedillo R, et al. Neurocysticercosis: radiologic-pathologic correlation. Radiographics. 2010;30(6):1705-1719.
DIAGNOSIS: Vesicular neurocysticercosis
CYST WITH MURAL NODULE APPEARANCE:
Fluid-secreting tumors have a mixed solid and cystic appearance,
with the “mural nodule” representing tumor,
and the large adjacent cyst representing reactive fluid.

Fig. 13: Axial contrast-enhanced T1-weighted MR shows a right cerebellar cystic lesion with enhancing mural nodule (arrow).
References: Garg A, Suri A, Gupta V. Cyst with a mural nodule: unusual case of brain metastasis. Neurol India. 2004;52(1):136. Lee SR, Sanches J, Mark AS, et al. Posterior fossa hemangioblastomas: MR imaging. Radiology. 1989;171(2):463-468.
DIFFERENTIAL DIAGNOSIS:
· Hemangioblastoma
· Pilocytic astrocytoma in children,
· Infection
· Metastasis
CRESCENT SIGN:
Subdural hematomas are bleeds between the dura mater and arachnoid mater.
At imaging,
SDH is typically crescentic in appearance,
tracking along the cerebral convexities.
These can cross beneath cranial sutures,
stopping only at dural reflections such as the falx cerebri and tentorium cerebelli
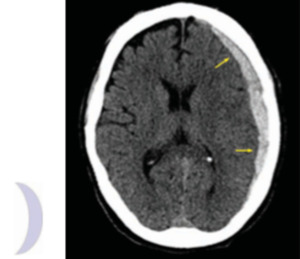
Fig. 14: Axial CT shows crescent shaped acute left hemispheric subdural hematoma (arrows)
References: Brant WE, Helms C. Fundamentals of Diagnostic Radiology, 3rd ed. Baltimore: Lippincott Williams and Wilkins, 2012.
DIAGNOSIS: Subdural hematoma
DAWSON FINGERS:
Multiple sclerosis (MS) is a chronic demyelinating disorder characterized by spatial and temporal heterogeneity.
On T2-weighted and FLAIR MR,
characteristic ovoid plaques are seen radiating perpendicularly from the lateral ventricles (“Dawson fingers”).
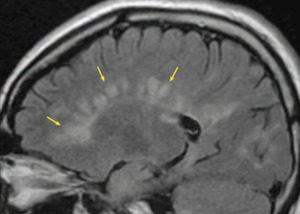
Fig. 15: Sagittal FLAIR MR shows multiple ovoid hyperintensities (arrows) contacting the corpus callosum and radiating perpendicularly from the lateral ventricles
References: Mai-Lan Ho, MD, Ronald L. Eisenberg, MD, JD,2014, Textbook of Neuro Radiology signs, United States, McGraw-Hill Education.
DIAGNOSIS: Multiple Sclerosis
DURAL TAIL SIGN:
The presence of a “dural tail” is classic for meningioma.
Occasionally,
other extra-axial and peripherally located intra-axial lesions can also involve the dura.
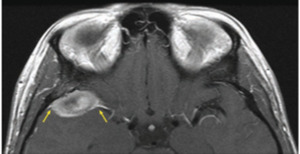
Fig. 16: Axial contrast-enhanced T1-weighted MR shows a right middle cranial fossa extra axial mass with dural thickening along the greater sphenoid wing (arrows). There is posterior displacement of the right temporal gyri.
References: Guermazi A, Lafi tte F, Miaux Y, et al. The dural tail sign—beyond meningioma. Clin Radiol. 2005;60(2):171-188. Wallace EW. The dural tail sign. Radiology. 2004;233(1):56-57.
DIFFERENTIAL DIAGNOSIS:
• Meningioma
• Other dural masses
EYE OF TIGER SIGN:
Neurodegeneration with brain iron accumulation,
refers to a spectrum of pediatric neurodegenerative disorders characterized by abnormal iron deposition in the basal ganglia.
On T2-weighted and SWI MR,
the globus pallidi demonstrate high signal intensity with a hypointense rim (“eye of the tiger” sign).
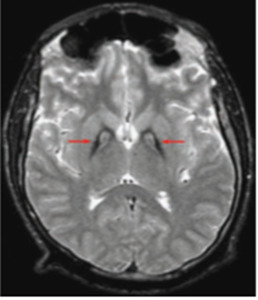
Fig. 17: Axial T2-weighted MR shows hyperintense globus pallidi with hypointense rims (arrows).
References: Guillerman RP. The eye-of-the-tiger sign. Radiology. 2000;217(3):895-896. Savoiardo M, Halliday WC, Nardocci N, et al. Hallervorden-Spatz disease: MR and pathologic fi ndings. AJNR Am J Neuroradiol. 1993;14(1):155-162.
DIFFERENTIAL DIAGNOSIS:
• Pantothenate kinase–associated neurodegeneration
• Other extrapyramidal parkinsonian disorders
HOCKEY STICK APPEARANCE:
Creutzfeldt-Jakob disease (CJD) is a rapidly progressing and fatal dementia caused by prions. Symmetric T2 hyperintensities and reduced diffusion can be seen in the pulvinar and dorsomedial nuclei of the thalamus (“hockey stick” appearance).
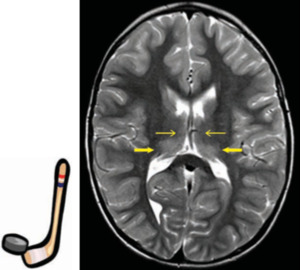
Fig. 18: Axial T2-weighted MR shows symmetric increased signal in the dorsomedial (thin arrows) and pulvinar nuclei (thick arrows) of both thalami.
References: Collie DA, Summers DM, Sellar RJ, et al. Diagnosing variant Creutzfeldt-Jakob disease with the pulvinar sign: MR imaging findings in 86 neuropathologically confirmed cases. AJNR Am J Neuroradiol. 2003;24(8):1560-1569.
DIAGNOSIS: Creutzfeldt-Jakob disease
HUMMINGBIRD/PENGUIN SIGN:
Progressive supranuclear palsy,
there is selective atrophy of the midbrain tectum and tegmentum,
with flattened or concave margins and a deep interpeduncular fossa.
On sagittal images,
the “hummingbird” sign refers to midbrain atrophy juxtaposed with normal pons and medulla.
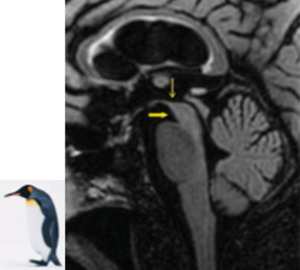
Fig. 19: Sagittal FLAIR MR shows midbrain atrophy with concave superior margin (thin arrow) and deep inter peduncular fossa (thick arrow). The pons and medulla are normal in size.
References: Botha H, Whitwell JL, Madhaven A, et al. The pimple sign of progressive supranuclear palsy syndrome. Parkinsonism Relat Disord. 2013 Nov 4.
DIAGNOSIS: Progressive supranuclear palsy
BICONVEX LENTICULAR APPEARANCE:
Epidural hematomas (EDHs) are bleeds located between the skull and dura mater.
These are caused by major trauma with skull fractures producing lacerations of the meningeal arteries (usually MMA).
At imaging,
EDH has a “lenticular” appearance that is constrained by the cranial sutures.
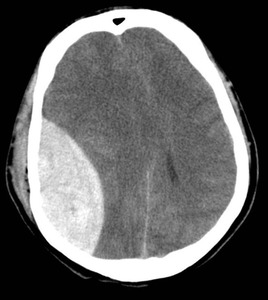
Fig. 20: Biconvex hyperdense collection in the right fronto parietal region causing significant midline shift and mass effect is noted.
References: Brant WE, Helms C. Fundamentals of Diagnostic Radiology, 3rd ed. Baltimore: Lippincott Williams and Wilkins, 2012.
DIAGNOSIS: Extra Dural Hematoma
MICKEY MOUSE,
MORNING GLORY SIGN:
Progressive supranuclear palsy on axial images,
the “Mickey Mouse” or “morning glory” sign is produced by midbrain atrophy with preserved cerebral peduncles.

Fig. 21: Axial FLAIR MR shows midbrain atrophy with concave lateral margins of the tegmentum (arrows). The cerebral peduncles are normal in size.
References: Adachi M, Kawanami T, Ohshima H, et al. Morning glory sign: a particular MR fi nding in progressive supranuclear palsy. Magn Reson Med Sci. 2004;3(3):125-132
DIAGNOSIS: Progressive supranuclear palsy
.
MOUNT FUJI SIGN:
Progressive air accumulation can develop because of a ball-valve mechanism,
producing mass effect on adjacent brain.
An important sign of tension pneumocephalus is compression and separation of the frontal lobes,
resembling the double-peaked silhouette of Mount Fuji.
Fig. 22: Axial CT shows bifrontal pneumocephalus and subdural fluid collections. There is compression of the frontal lobes and widening of the interhemispheric space (arrow).
References: Michel SJ. The Mount Fuji sign. Radiology. 2004;232(2):449-450
DIFFERENTIAL DIAGNOSIS:
• Postsurgical pneumocephalus
• Tension pneumocephalus.
BRIGHT/DENSE/WHITE CEREBELLUM SIGN:
In diffuse cerebral edema,
there is relative sparing of the basal ganglia,
brainstem,
and cerebellum. The preserved cerebellum appears brighter than the edematous cerebrum on CT (“white cerebellum”)
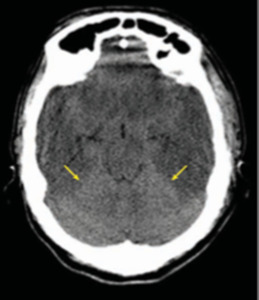
Fig. 23: Axial CT reveals diffuse cerebral edema with hypoattenuation, sulcal effacement, and loss of gray-white distinction. The cerebellum is preserved and appears relatively hyperdense (arrows).
References: Brant WE, Helms C. Fundamentals of Diagnostic Radiology, 3rd ed. Baltimore: Lippincott Williams and Wilkins, 2012..
DIAGNOSIS: Diffuse cerebral edema
Diffuse cerebral edema occurs in various settings including trauma,
hypoxia,
ischemia,
and infection.
RACING CAR APPEARANCE/PARALLEL VENTRICLES:
In case of dysenesis or agenesis of corpus callosum,
the lateral ventricles assume a parallel orientation,
with narrow elongated frontal horns and dilated occipital horns (colpocephaly,
“racing car” appearance).
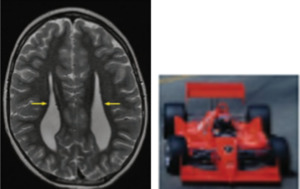
Fig. 24: Axial T2-weighted MR shows widely spaced and parallel lateral ventricles (arrows), with pointed frontal horns and dilated occipital horns.
References: Atlas SW. Magnetic Resonance Imaging of the Brain and Spine. 4th ed, vol. 1. Philadelphia: Wolters Kluwer; 2008
DIAGNOSIS: Callosal agenesis
FIGURE OF SIGHT APPEARANCE/ SNOWMAN APPEARANCE:
Pituitary macroadenomas are benign,
usually nonfunctioning tumors greater than 1 cm in size.
These gradually replace the pituitary gland,
grow up through the diaphragma sellae into the suprasellar region with a “snowman” appearance.
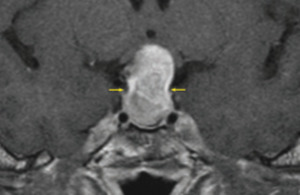
Fig. 25: Coronal contrast-enhanced T1-weighted MR shows an enhancing sellar/suprasellar mass with focal constriction at the diaphragma sellae (arrows).
References: Hess CP, Dillon WP. Imaging the pituitary and parasellar region. Neurosurg Clin N Am. 2012;23(4): 529-5
DIAGNOSIS: Pituitary macroadenoma
DUMBELL SIGN:
Esthesioneuroblastoma is a rare(PNET) that arises from the olfactory epithelium in the superior nasal cavity.
Invasion through the cribriform plate produces a “dumbbell” shape.
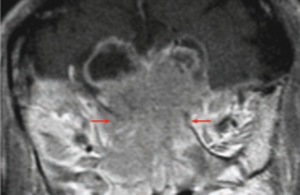
Fig. 26: Coronal contrast-enhanced T1-weighted MR shows an enhancing mass centered at the cribriform plate (arrows), with intracranial and intranasal extension. Peritumoral cysts are present along the superior margin of the mass
References: Pickuth D, Heywang-Köbrunner SH, Spielmann RP. Computed tomography and magnetic resonance imaging features of olfactory neuroblastoma: an analysis of 22 cases. Clin Otolaryngol Allied Sci. 1999;24(5):457-461
DIFFERENTIAL DIAGNOSIS:
• Esthesioneuroblastoma
• Sinonasal carcinoma
EMPTY SELLA SIGN:
Empty sella refers to a pituitary fossa that is largely devoid of tissue and fi lled with cerebrospinal fluid.
It can be primary or secondary.
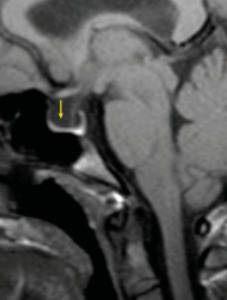
Fig. 27: Sagittal T1-weighted MR shows increased CSF within the sella, with fl attening of the pituitary gland (arrow) against the sellar floor.
References: Haughton VM, Rosenbaum AE, Williams AL, et al. Recognizing the empty sella by CT: the infundibulum sign. AJR Am J Roentgenol. 1981;136(2):293-295.
DIFFERENTIAL DIAGNOSIS:
• Normal variant
• Idiopathic intracranial hypertension
• Secondary empty sella
HYPERDENSE MCA SIGN:
This is the earliest CT sign of arterial ischemia and is best appreciated in the MCA.

Fig. 28: Axial noncontrast CT shows a hyperdense right MCA (arrow)
References: Koo CK, Teasdale E, Muir KW. What constitutes a true hyperdense middle cerebral artery sign. 2000;10(6):419-423.
DIAGNOSIS: Hyper acute MCA infarct.
EMPTY DELTA SIGN:
Cerebral venous thrombosis
Contrast-enhanced images demonstrate an “empty delta” appearance,
with central filling defect surrounded by contrast.
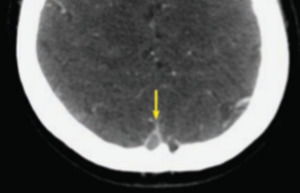
Fig. 29: Axial contrast-enhanced CT shows a central filling defect outlined by contrast in the superior sagittal sinus (arrow).
References: Daif A, Kolawole TM, Ogunniyi A, et al. The pseudo-delta sign is unreliable in differentiating between aneurysmal SAH and sinus thrombosis in unenhanced brain CT. Eur J Radiol. 1998;28(1):95-97.
DIAGNOSIS: Sagittal sinus thrombosis.
CAPUT MEDUSAE,MEDUSA HEAD,SPOKE WHEEL SIGN:
Developmental venous anomaly (DVA) on venous phase imaging,
dilated and radially arranged collecting veins converge toward a common trunk (“Medusa head” ),
which drains to either the superficial or deep venous network.

Fig. 30: Axial contrast-enhanced T1-weighted MR show anomalous cerebellar draining veins (thick arrows) that converge toward a common pontine venous trunk (thin arrows).
References: Lee C, Pennington MA, Kenney CM 3rd. MR evaluation of developmental venous anomalies: medullary venous anatomy of venous angiomas. AJNR Am J Neuroradiol. 1996;17(1):61-70.
DIAGNOSIS: Developmental venous anomaly.
COTTON WOOL SPOTS:
The sclerotic phase of pagets disease produces a “cotton-wool” appearance with fluffy areas of sclerosis that can cross sutures.
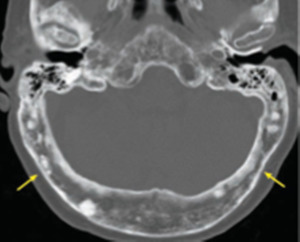
Fig. 31: Axial CT shows a diffusely thickened calvarium with multiple patchy areas of sclerosis (arrows).
References: Smith SE, Murphey MD, Motamedi K, et al. From the archives of the AFIP. Radiologic spectrum of Paget disease of bone and its complications with pathologic correlation. Radiographics. 2002;22(5):1191-1216.
DIAGNOSIS: Paget disease,
sclerotic phase
SALT AND PEPPER SKULL:
The characteristic “salt and pepper” appearance of the skull reflects chronic HPTH with multifocal resorption and sclerosis.

Fig. 32: Axial CT shows numerous lytic and sclerotic foci throughout the calvarium.
References: McDonald DK, Parman L, Speights VO Jr. Best cases from the AFIP: primary hyperparathyroidism due to parathyroid adenoma. Radiographics. 2005;25(3):829-834
DIAGNOSIS: Hyperparathyroidism
INSULAR RIBBON SIGN:
The insular cortex is supplied by the middle cerebral artery.
When the MCA circulation is occluded,
acute insular edema (“insular ribbon”) obscures the adjacent basal ganglia and is an early finding of MCA infarction.
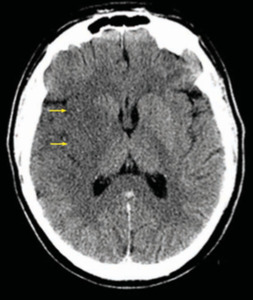
Fig. 33: Axial CT shows edema of the right insula (arrows), obscuring the adjacent putamen.
References: Truwit CL, Barkovich AJ, Gean-Marton A, et al. Loss of the insular ribbon: another early CT sign of acute middle cerebral artery infarction. Radiology. 1990;176(3):801-806.
DIAGNOSIS: Hyper acute MCA infarct
