Keywords:
Oncology, Breast, Computer applications, CT, CT-Quantitative, CAD, Computer Applications-Detection, diagnosis, Radiation therapy / Oncology, Computer Applications-General, Cancer, Molecular, genomics and proteomics, Neoplasia
Authors:
M. Awais, A. Rahim; Karachi/PK
DOI:
10.26044/ecr2019/C-1189
Methods and materials
A retrospective study was performed at the Dow Institute of Radiology and all women aged 18 years or older were eligible for inclusion.
Data was retrieved using the hospital’s electronic medical record (EMR) system.
All patients who had histopathological confirmation of infiltrative ductal breast carcinoma and who subsequently underwent CT chest for staging were included in the study.
All patients who had either tumour recurrence or previous surgery related to the breast were excluded from the study.
Histopathological and immunohistochemical data were recorded using a structured pro forma.
Textural analysis was performed by a consultant radiologist having more than 5 years of experience in body imaging using free third-party software (LIFEx version 2.0).
[9] DICOM images of CT examination were exported through the hospital picture archiving and communication system (PACS) to a local desktop.
These images were then imported in LIFEx and textural analysis was performed as laid out in the software’s documentation guide.
Axial CT slices with the greatest dimension of tumour were selected and a 2D region of interest (ROI) was drawn around the lesion.
Care was taken to place the ROI accurately over the lesion edges avoiding surrounding soft tissue.
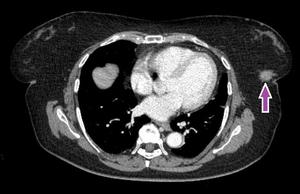
Fig. 1: Arrow showing a spiculated lesion in the lower outer quadrant of the left breast.
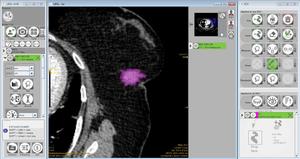
Fig. 2: ROI drawn on the lesion using Lifex software.
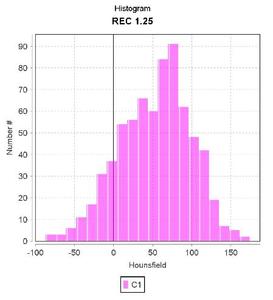
Fig. 3: Histogram of the indexed lesion in lower outer quadrant of the left breast.
Thereafter,
histogram and textural parameters were calculated automatically by the software.
Table 1 enlists the textural parameters calculated.
|
Textural parameters
|
|
A. Histogram
|
|
Skewness
|
|
Kurtosis
|
|
Entropy (log10)
|
|
Entropy (log2)
|
|
Energy
|
|
B. Shape
|
|
Shape volume (mL)
|
|
Shape volume (number of voxels)
|
|
C. Grey-level co-occurrence matrix (GLCM)
|
|
Homogeneity
|
|
Energy
|
|
Contrast
|
|
Correlation
|
|
Entropy_log_10
|
|
Entropy_log_2
|
|
Dissimilarity
|
|
D. Grey-level run length matrix (GLRLM)
|
|
SRE (short-run emphasis)
|
|
LRE (long-run emphasis)
|
|
LGRE (long grey-level run emphasis)
|
|
HGRE (high grey-level run emphasis)
|
|
SRLGE (short-run low grey-level emphasis)
|
|
SRHGE (short-run high grey-level emphasis)
|
|
LRLGE (long-run low grey-level emphasis)
|
|
LRHGE (long-run high grey-level emphasis)
|
|
GLNU (grey-level non-uniformity for run)
|
|
RLNU (run length non-uniformity)
|
|
RP (run percentage)
|
|
E. Neighbourhood grey-level different matrix
|
|
Coarseness
|
|
Contrast
|
|
Busyness
|
|
F. Grey-level zone length matrix
|
|
SZE (short-zone emphasis)
|
|
LZE (long-zone emphasis)
|
|
LGZE (low grey-level zone emphasis)
|
|
HGZE (high grey-level zone emphasis)
|
|
SZLGE (short-zone low grey-level emphasis)
|
|
SZHGE (short-zone high grey-level emphasis)
|
|
LZLGE (long-zone low grey-level emphasis)
|
|
LZHGE (long-zone high grey-level emphasis)
|
|
GLNU (grey-level non-uniformity for zone)
|
|
ZLNU (zone length non-uniformity)
|
|
ZP (zone percentage)
|
Table 1: List of various textural parameters calculated using the free third-party software
The results were exported as an excel file and all the data was stored in a local database.
Subsequently,
these data along with other histopathological and immunohistochemical parameters were entered in SPSS (Statistical Package for Social Sciences version 20) files.
Pearson’s product-moment correlation was used to assess the relationship between quantitative CT textural parameters and other histopathological or immunohistochemical features.
A p-value of less than 0.05 was considered statistically significant.
The quantitative textural parameters included in the statistical analysis are enumerated in Table 1.
