Table 01 presents clinical variables of patients.
Results for individual patients was presented in Table 02.
There were no differences in soft or fibrous tumors regarding,
age,
sex,
contrast enhancement patterns,
type of tumors and complete or incomplete surgical treatment. All 45 patients were first approached via transsphenoidal. From 45 patients,
25 (55%) were women and 20 (44%) were male.
Mean age of patients were 56 (SD=13.25) years,
ranging from 39 to 77 years. According to with surgical impression,
twenty-nine (47%) PAMs were classified as of soft consistency and sixteen (35.5%) were of fibrous consistency. The neuroimaging homogeneity or heterogeneity was determined by the radiologist using post-contrast T1 WI.
Twenty-three tumors were homogeneous to gadolinium contrast enhancement (51.1%).
Of the total of 45 PAMs evaluated by immunohistochemistry,
28 (62.2%) were secretory and 17 (37.8%) were non-secretory.
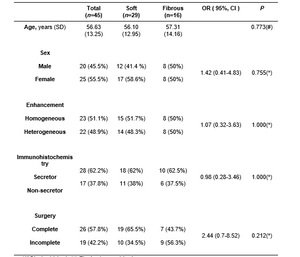
Table 1: (#)Student t-test; (*) Fischerâs exact test
Clinical Variables According with PAMs Consistency
The real tumor consistency was determined by the neurosurgeon during a surgical procedure.
The cellular type of PAMs was determined by anatomopathological studies.
All patients underwent post-operatory MRI neuroimaging. In our series,
26 (57.8%) PAMs were completely removed by transsphenoidal surgery and 19 (42.2%) patients had incomplete tumor resection,
being ten of them soft and nine of them fibrous PAMs.
In both studies,
the isolated signal of the PAMs and the ACPs ratios could discriminate the consistency of tumors. However,
ACP showed greater accuracy than the isolated T2WI signal for preoperatively predicting the consistency of the tumors.
The mean ACP signal intensity ratio values for the 29 soft tumors was 1.654 (SD=0.157) and the mean values for the 16 fibrous tumors were 1.287 (SD=0.222),
with p<0.0001,
and 95% Confidence Interval of 0.795 to 0.977.
These results are shown in Figure 2.
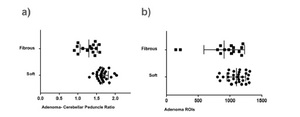
Fig. 2: Distribution of the signal intensity according with macroadenoma consistency. a) Is showing distribution of the PAMs crude signal intensity according with macroadenoma consistency. Mean ROIs signal between fibrous and soft PAMs showed a significant statistical difference (p=0.013). b) Is showing PAMs ACP signal intensity ratio according with macroadenoma consistency. Mean ROIs ACP signal intensity ratio between fibrous and soft PAMs also showed a significant statistical difference (p<0.0001).
To evaluate the accuracy of the index derived from the study we constructed a ROC curve.
This result is showing in Figure 3.
Using T2WI index signal intensity in our patients,
the ROC curve showed an accuracy of 0.939 in predicting PAMs consistency.
T2WI index signal higher than 1.59 were associated with soft PAMs (sensitivity 72.4%; specificity 100.0%),
while T2WI index signal lower than 1.27 were associated with fibrous PAMs (sensitivity 100.0%; specificity 37.5%).
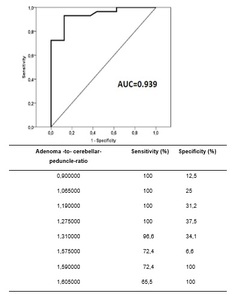
Fig. 3: ROC curve of our study.
In the same way,
we used data presented by Smith et al [1] to produce a ROC curve.
The area under the ROC curve (AUC) in our series was 0.939 (S.E.
= 0.034).
In the Smiths series,
AUC was 0.804 (SE = 0.080). The difference between the area under the ROC curve of our series and Smith et al series was 0.135 (SE = 0.087),
a non-significant difference (p = 0.122).
Thus,
we combined data and showed results in the ROC curve that combine the two series.
For combined results,
we obtained AUC = 0.886 (SD = 0.46,
95% CI = 0.795-0.977),
with p <0.0001.
This result is shown in Figure 4.
For combined results,
T2WI index signal higher than 1.79 were associated with soft PAMs (sensitivity 30.4 %; specificity 100 %),
while T2WI index signal lower than 1.27 were associated with fibrous PAMs (sensitivity 100%; specificity 30.4%).
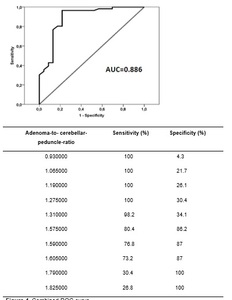
Fig. 4: Combined ROC curve
In this study it was found 16 fibrous tumors,
wherein eight (50%) were homogeneously and eight (50%) were heterogeneously on T2WI; and 29 soft tumors,
in which 15 were homogeneously and 14 were heterogeneously (T Fischer,
p =1.000,
T-Test p<0.090).
We concluded that the consistency of pituitary adenomas cannot be reliably predicted bases only MRI intensities as previously seen by Bahuleyan et al.
[14].
We choose to reinvestigate T2WI due to its versatility.Six of our fibrous tumors had ratios < 1.3; 21 of our soft tumors had ratios > 1.6.
Tumors with ratios between 1.3 and 1.6 can be either soft or fibrous.
None of our fibrous tumors had ratios > 1.6; none of our soft tumors had ratios < 1.3.
Our study as seen by Smith et al,
showed these ratio cutoff values serve as good screening tools with high sensitivity and good specificity for identification of tumors that are likely to be firm or soft.
In our series the consistency categories were dichotomized into just two groups,
and this was not subjectively by neurosurgeon but in clinical practice,
many types of consistency exist.
Six of our fibrous tumors had ratios < 1.3; 21 of our soft tumors had ratios > 1,6. There were 18 tumors with ratios between 1.3 and 1.6 that could be either soft or fibrous and likely represents those adenomas of an intermediate group of characteristics of either group.
The ratio values selected of our study could be determinant for neurosurgeon if the PAM will be easy or hard to remove during the surgery.
The present study has limitations that must be pointed out.
Our study consisted of a small series of cases.
In our study the analysis of the diffusion technique of pituitary tumors was not done because it is not included in our routine pituitary tumor protocol,
but we think that it could eventually be used for predicting tumor consistency.
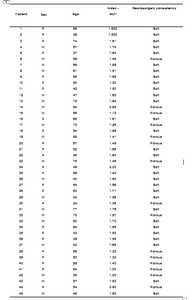
Table 2: F = female; M = male; ACP = adenoma-cerebellar peduncle.
Description of the 45 Patients
