ECR 2019 / C-2595
Evaluation of different lesion SDNR definitions in case of breast tomosynthesis and 2D digital mammography
Congress:
ECR 2019
Poster Number:
C-2595
Type:
Scientific Exhibit
Keywords:
Quality assurance, Acceptance testing, Mammography, Radiation physics
Authors:
S. Bara, A. Petropoulos, S. Skiadopoulos, G. Vlachopoulos, A. Karahaliou, G. A. T. Messaris, L. Costaridou; Patras/GR
DOI:
10.26044/ecr2019/C-2595
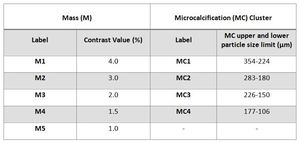
 and sizes of microcalcification (MC) clusters in TOR MAM mammographic phantom analyzed in this study.")
Table 1:
Nominal contrast values of masses (M) and sizes of microcalcification (MC)...

Fig. 1:
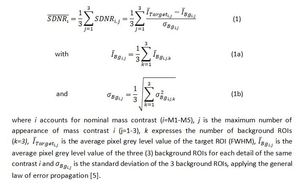
The equation used for calculating the average SDNR value for the first mass...
 at each of the 3 positions located, in DM mode.")
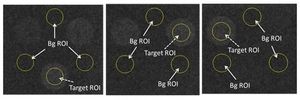
Fig. 2:
Example of first Mass SDNR ROI definition, with target and background ROIs for...

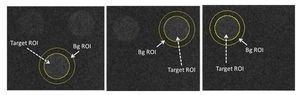
Fig. 3:
The equation used for calculating the average SDNR value for the second mass...
 at each of the 3 positions located, in DM mode.")
Fig. 4:
Example of second Mass SDNR ROI definition, with target and background ROIs for...

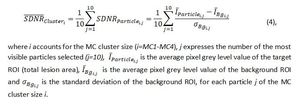
Fig. 5:
The equation used for calculating the average SDNR value for the first MC...
 and circular background ROI arrangement in DM mode.")
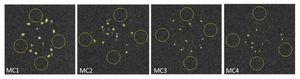
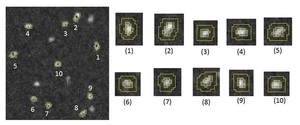
Fig. 6:
Example of the first MC cluster SDNR definition for the 4 microcalcification...

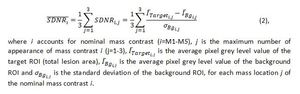
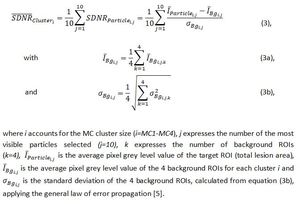
Fig. 7:
The equation used for calculating the average SDNR value for the second MC...
 and background (surrounding) ROIs for MC1 (upper and lower particle size limit: MC1: 354-224 μm) in DM mode.")
Fig. 8:
Example of the second MC cluster SDNR definition: target (segmented MC) and...