ECR 2019 / C-2620
Clinically derived dose reference levels (DRL) and calculated peak skin doses (PSD) for PCI multivessel and PCI multivessel with chronic total occlusion (CTO) studies in a busy interventional cardiac centre.
Congress:
ECR 2019
Poster Number:
C-2620
Type:
Scientific Exhibit
Keywords:
Ischaemia / Infarction, Dosimetric comparison, Biological effects, Radiation effects, Catheters, Arterial access, Percutaneous, Fluoroscopy, Catheter arteriography, Radioprotection / Radiation dose, Cardiovascular system, Cardiac
Authors:
T. Heary, R. Faulkner; DUBLIN/IE
DOI:
10.26044/ecr2019/C-2620
 and Male(blue) patients for each PCI type.
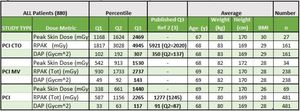
The table shows the ranges of Age, Weight, Height, BMI in addition to the ranges of dose metrics: DAP, RPAK, Peak Skin Dose and the numbers of studies (n) for each PCI type.")
Fig. 1:
Overview of the data for Female(pink) and Male(blue) patients for each PCI...
")
Fig. 2:
Dose Reference Levels for all PCI procedures on ALL patients (male & female)

Fig. 3:
Dose Reference Levels for all PCI procedures on FEMALE patients

Fig. 4:
Dose Reference Levels for all PCI procedures on MALE patients

Fig. 5:
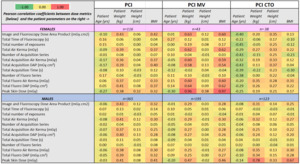
Pearson correlation coefficients with colour coding showing the relative...