CT Scanning
All CT scans were performed on a 64-detector row CT scanner (Lightspeed VCT; GE Healthcare,
Milwaukee,
Wisconsin).
Dose measurement to investigate the shape of the bowtie filters :
The scanning parameters were as follows: scan mode,
helical scan; beam width,
20.0 mm; section thickness,
0.625 mm; pitch factor,
0.531 mm/rotation; gantry rotation time,
1.0 seconds; detector collimation,
64×0.625 mm; Tube voltage.
80-,
100-,
120-,
and 140 kVp; Tube current set on 10mA~200mA (keeping 9.5 mGy in CTDIvol); matrix size,
512×512; Beam bowtie filter,
small and large; and standard reconstruction kernel. We performed our own made phantom to obtain the shape of each bowtie filter during different tube voltage.
We measured the radiation dose using the 10 cm pencilization chamber (20 × 6-3 CT / radiation monitor 2026 C; Radcal,
Monrovia,
California).
This phantom was surrounded by a 5 mm thick lead metal with a 5 mm slit so that X-rays could be conducted on only a part of the CT chamber.
Furthermore,
15 cm outside the CT chamber was covered in a 3 mm thick layer of lead with a 5 mm slit (Fig.1 a).
The phantom moved at 1 cm intervals toward the off-center,
from the ISO-center (Fig.1 b,
c).
We then measured the radiation dose from ISO-Center to 20 cm.
We compared the radiation dose at each tube voltage and each bowtie filter.
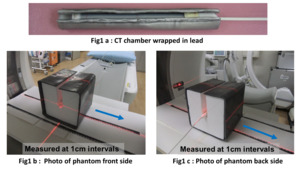
Fig. 1: (a,b,c) : Verification of radiation dose measurement to obtain the shape of bowtie filters
Image quality and radiation dose by using the ATCM system for each bowtie filter and each tube voltage :
The scanning parameters were as follows: scan mode,
helical scan; beam width,
40.0 mm; section thickness,
0.625 mm; pitch factor,
1.375 mm/rotation; gantry rotation time,
0.4 seconds; detector collimation,
64×0.625 mm; Tube voltage.
80-,
100-,
120-,
and 140 kVp; Tube current was set on 10mA~200mA keeping noise index 10; matrix size,
512×512; Beam bowtie filter,
small and large; and standard reconstruction kernel.
To evaluate the image quality and radiation dose for the different bowtie filters and different tube voltages,
we used the cylinder acrylic Phantom (16 cm) by using 10cm chamber.
The chamber was inserted into the cylinder acrylic phantom at 4 edge and center.
Then,
the average dose was calculated and compared by measuring 5 times at the above scanning condition. Image noise was measured at the edge 4 points and the center of the image 5 times,
and the average SD value and radiation dose was compared.
(Fig.2)
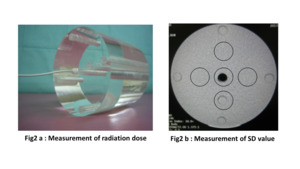
Fig. 2: (a,b) : Verification of image quality and radiation dose daring each bowtie filter and each tube voltages
Statistical analysis
For the analysis of the radiation dose at the different tube voltages with beam shaping filter we used Steel-Dwass analysis.
Values of p < 0.05 were considered to be statistically significant.
Statistical analyses were with free statistical software (version 3.0.2,
the R project for statistical computing;  http://www.r-project.org/).

 : Verification of radiation dose measurement to obtain the shape of bowtie filters")
 : Verification of image quality and radiation dose daring each bowtie filter and each tube voltages")