Dose measurement to investigate the shape of the bowtie filters
The result of each tube voltage when small bowtie filter is used is shown.
The radiation dose at the ISO center was 4.95 mGy at 80 kVp,
4.10 mGy at 100 kVp,
3.75 mGy at 120 kVp,
3.52 mGy at 140 kVp,
and the maximum dose of each tube voltage was shown.
The radiation dose at 14 cm from the ISO center was 0.65 mGy at 80 kVp,
0.65 mGy at 100 kVp,
0.68 mGy at 120 kVp,
0.70 mGy at 140 kVp and attenuated from 1 cm to 14 cm.
The result of each tube voltage when middle bowtie filter is used is shown.
The radiation dose at the ISO center was 4.20 mGy at 80 kVp,
3.51 mGy at 100 kVp,
3.16 mGy at 120 kVp,
3.11 mGy at 140 kVp,
and the maximum dose of each tube voltage was shown.
The radiation dose at 17 cm from the ISO center was 0.48 mGy at 80 kVp,
0.48 mGy at 100 kVp,
0.49 mGy at 120 kVp,
0.53 mGy at 140 kVp and attenuated from 3 cm to 17 cm.
The result of each tube voltage when large bowtie filter is used is shown.
The radiation dose at the ISO center was 3.10 mGy at 80 kVp,
2.71 mGy at 100 kVp,
2.81 mGy at 120 kVp,
2.62 mGy at 140 kVp,
and the maximum dose of each tube voltage was shown.
The radiation dose at 20 cm from the ISO center was 0.37 mGy at 80 kVp,
0.38 mGy at 100 kVp,
0.44 mGy at 120 kVp,
0.46 mGy at 140 kVp and attenuated from 4 cm to 20 cm.
(Tab.1)
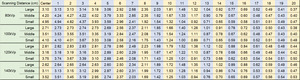
Table 1: It displays the measured dose values
From the ISO center up to 12 cm,
80 kVp indicated the highest dose to each bowtie filter.
Damping of radiation dose occurred from 4 cm with a large bowtie filter,
3 cm for the middle bowtie filter,
1 cm for the small bowtie filter.
The Small Bowtie Filter showed a low dose value sharply as it became OFF - Center compared to other Bowtie Filters.
Small and middle bowtie filters showed high doses as low tube voltage,
but the large bowtie filter showed high dose at 120 kVp rather than 100 kVp.
For each tube voltage,
the small bowtie filter showed high doses from the ISO center up to about 4 cm,
but the large bowtie filter showed high doses from the ISO center up to about 5 cm.
(Fig.3-9)
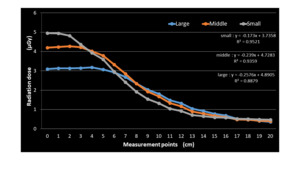
Fig. 3: Comparison of radiation dose between 80kVp tube voltage and each bowtie filter
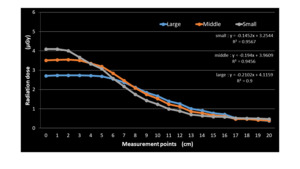
Fig. 4: Comparison of radiation dose between 100kVp tube voltage and each bowtie filter
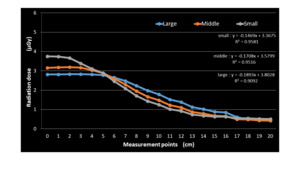
Fig. 5: Comparison of radiation dose between 120kVp tube voltage and each bowtie filter
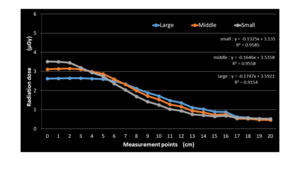
Fig. 6: Comparison of radiation dose between 140kVp tube voltage and each bowtie filter
Image quality and radiation dose by using the ATCM system for each bowtie filter and each tube voltage
The radiation doses at small bowtie filter were 3.88,
3.77,
4.17 and 4.09 mGy at 80-,
100-,
120- and 140kVp,
respectively.
The radiation doses at middle bowtie filter were 4.03,
4.17,
4.46 and 4.21 mGy at 80-,
100-,
120- and 140kVp,
respectively.
The radiation doses at large bowtie filter were 3.85,
3.76,
3.67 and 4.08 mGy at 80-,
100-,
120- and 140kVp,
respectively.
There were significant differences in the radiation dose between middle bowtie filter and large,
small bowtie filter for each of the tube voltages.
(Fig.10)
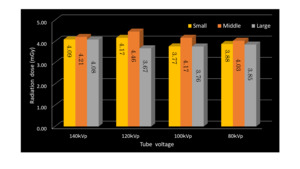
Fig. 10: Comparison of radiation dose between each tube voltage and each bowtie filter
The SD values at small bowtie filter were 8.48,
8.61,
8.47 and 8.53 HU at 80-,
100-,
120- and 140kVp,
respectively. The SD values at middle bowtie filter were 8.67,
8.32,
8.36 and 8.45 HU at 80-,
100-,
120- and 140kVp,
respectively. The SD values at large bowtie filter were 8.62,
8.44,
8.54 and 8.50 HU at 80-,
100-,
120- and 140kVp,
respectively.
There were no significant differences in the SD value between each tube voltage and each bowtie filter.
(Fig.11)
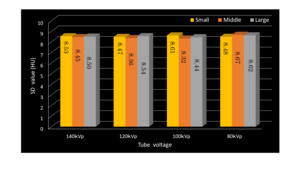
Fig. 11: Comparison of SD value between each tube voltage and each bowtie filter


