Medial and lateral soft tissues:
The medial patellofemoral ligament, a central thickening of the medial retinaculum, is the main passive medial stabilizer in full extension of the knee and up to 20° of flexion.
Contribute with fibers: posteromedial capsule, Collateral medial ligament; and the vastus medialis and vastus intermedius aponeurosis.
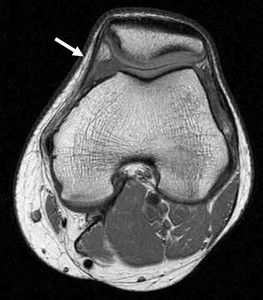
Fig. 6: The white arrow shows the medial retinaculum. Its fibers originate distal to the insertion of the adductor magnus muscle and proximal to the origin of the collateral medial ligament and insert in the proximal two-thirds of patellar medial margin.
Acute traumatic dislocation mainly affects young athletes, being the involved mechanism a twist of the lower extremity with the knee extended and in external rotation. It can also be a consequence of a direct trauma to the patella.

Fig. 7: Case 1. 27 years old female with knee extension trauma. Axial fat sat proton density images show joint effusion and anterolateral soft tissue edema (White arrows), tear and medial patellofemoral ligament fibers elongation (White dotted arrow) and patellar lateralization associated to lateral retinaculum loss of tension (blue arrows).
Lateral retinaculum is made up of superficial fibers that extend from the fascia latae tensor, iliotibial band and the lateralis vastus; and deep fibers that come from the proximal patelloepicondyleal, lateral patellotibial, lateral patellofemoral and lateral collateral ligament.

Fig. 8: The white arrow depicts the lateral retinaculum. It helps the lateral femoral condyle as stabilizer.
Patellar tilt:
Is a sensitive marker for patellar instability. Depends on cuadripceps contraction.
Several measures have been proposed:
- Congruence angle: is formed by bisecting the sulcus angle and a line from de vertex of the sulcus to the patellar apex. The average angle is -6° (SD ± 11°). When it does exceed the positive limit, the patella is laterally tilted.

Fig. 9: Congruence angle is measured at 45° of knee flexion.
- Patellar tilt: Composed by a line across tops of medial an lateral trochlea and a line outlining the lateral patellar facet. Normally opens laterally.

Fig. 10: Patellar tilt is measured at 20° of knee flexion.
- Patellar tilt angle: Is the angle formed by a line through the equator of the patella and a line between posterior femoral condyles. Normal range is 2 ± 2°.

Fig. 11: Patellar tilt angle is measured at 20° of knee flexion.

Fig. 12: Case 2. 30 years old male with chronic anterolateral right knee pain. Axial T2 weighted fat sat image (A) exhibit lateral patellar facet and trochlear chondral lesions (White arrows) associated with joint effusion (blue arrows). Sagittal fat sat T2 weighted images (B) show Hoffa´s fat hyperintensity below lateral femoral condyle (White arrows), findings consistent with Hoffa´s fat impingement. (C) Abnormal patellar tilt, proving an excessive lateral patellar compression syndrome.
Patellar height:
A high patella needs a greater of flexion to fit in the trochlear sulcus, so it must travel a greater distance without sulcus bone stabilization. There is more vulnerable to dislocation.
Several indexes have been developed to measure patellar height in different imaging modalities. The advantages and disadvantages of each one will be analyzed.
- Insall-Salvati: Is the ratio between the patellar tendon length and the patellar longest longitudinal diameter. The normal value range is 0.8-1.2. An index above 1.2 indicates patella alta.
- Caton Deschamps: It is calculated by dividing the distance between de lowest patellar edge and the anterior edge of the tibial plateau by the patellar articular lenght. The normal value is considered between 0.6 to 1.2.
- Blackburne Peel: Is the ratio distance between the length of a perpendicular line drawn from the tangent to a line through the surface of tibial plateau and inferior articular patellar edge; and the length of the patellar articular surface. When it exceeds 1, patella alta is diagnosed.
Patellar height must be measured in a true lateral knee radiography, at 30° of flexion, obtaining an adequate overlap of femoral condyles.

Fig. 13: Case 3. A 25 years old patient with anterior knee pain. In the same lateral knee radiography the Insall-Salvati index (A), Caton Deschamps (B) and Blacknurne Peel (C) indexes were measured. Values exceed the upper limit, indicating patella alta.
Insall-Salvati is reproducible and the only one validated in magnetic resonance, where the value limit increases 0.13 due to the lower degree of flexion at this imaging method (normal range 0.93-1.33).
Caton Deschamps is a simple and reliable method at several degrees of knee flexion and skeletal maturity. It is useful in the follow up of patients with tibial tubercle osteotomy. Its use is limited in patients with knee osteoarthritis because of the difficulty in identification of the tibial and patelar edges.
Trochlear groove morphology:
Trochlear dysplasia is defined as a shallow or flattened trochlea.
It is assessed in the true lateral knee radiography identifying the distal anterior cortical of the femur and the opaque line that represents the trochlear sulcus.
Recognize the following signs:

Fig. 14: Crossing sign:the trochlear groove line crosses the anterior contour of the femoral condyles. Constitutes a shallow trochlea.
Supratrochlear spur: bony prominence of the proximal portion of the trochlea (>3mm).
Double contour: Indicates a hypoplasic medial trochlear facet located posterior to the lateral trochlear facet
Adapted from: Saggin PRF, Saggin JI, Dejour D. Imaging in Patellofemoral Instability: An Abnormality-based Approach. Sports Med Arthrosc Rev 2012; 20: 145-151
Theoretically the supratrochlear spur hinders the sliding of the patella into the trochlea during knee flexion.

Fig. 15: The supratrochlear spur´s width is measured perpendicular to a line that is extrapolated from the anterior femur cortical. If measures more than 3mm is considered abnormal.
Sulcus angle:
Is a simple way to establish trochlear dysplasia, nevertheless it should not be assessed an isolated fact.
Is the angle measured between the two lines drawn through the anterior trochlear facets starting from the deepest point of the trochlear groove. Normal range is 138±6°.

Fig. 16: The knee axial radiography is obtained with 30 y 45° of flexion.
In axial images (computed tomography and magnetic resonance) the angle is measured according to 3 references:
- At 2.5-3 cm proximal to femorotibial space
- Axial image in which the femoral condyles are wider
- 1st axial image showing cartilage in both trochlear surfaces
Patellar morphology according to Wiberg:
- Type I: Facets are concave and symmetrical.
- Type II: Medial facet is slightly smaller.
- Type III: Medial facet is markedly smaller and has a vertical orientation.

Fig. 17: In the settings of patellofemoral instability, increased lateral stresses may produce a patella with an hypoplasic medial facet and a large lateral facet.
Axial limb alignment:
Increased femoral anteversion and lateral tibial torsion cause that the quadriceps activation force vector lateralizes the patella, increasing the risk of suffering a patellofemoral dislocation.
Hence, multimodal analysis must include the assessment of the axial alignment of the extremity. These measures are applicable and reproducible.

Fig. 18: First, ovelap axial tomography images of the femoral head and femoral condyles. The angle formed between a line that is drawn through the axis of the femoral neck and the posterior condylar line is the femoral anteversion. Normal range is 10° to 15°.
Adapted from: Waldt S, Woertler K, Measurements and classifications in musculoskeletal radiology. Thieme 2014
Tibial torsion angle is measured overlapping axial tomography images of the tibial plateau and the distal tibiofibular joint.

Fig. 19: Draw a tangent line posterior to tibial plateau, and a second line that divides in halves the tibial plafond and the distal fibula. The angle between these two lines is the tibial torsion. The average is around 20 and 30°, but if it surpasses 40° is considered increased.
Coronal limb alignment:
The tibial tubercle TT-TG distance is the distance between the tibial tubercle and the trochlear groove.
The normal range varies between 15 and 20mm.

Fig. 20: First, overlap two axial tomography images: one at the patellar tendon insertion and another where femoral condyles are wider (or the first image with cartilage on both trochlear surfaces).
Then, draw a line between two femoral condyles posterior surface.
After, draw 2 perpendicular lines:
-One bisecting the tibial tubercle.
-Another crossing the deepest point of the trochlear sulcus.
Distance between the two lines is measured.
Implies lateralization of tibial tubercle and is the imaging correlation to the Q angle (clinically assessed).
Magnetic resonance may underestimate this distance up to 4mm.
If abnormally high, the surgical correction consists in the tibial tubercle transfer (TT-TG goal of 12mm).

Fig. 21: Case 4. Images of a patient that required coronal and axial alignment assessment of the right lower limb. (A) Overlapped axial CT images of the femoral neck and distal femur prove a femoral anteversion of 16°. (B) Overlapped axial CT images of the distal femur and proximal tibia (patellar tendon insertion) show a TT-TG distance of 1.36cm and a sulcus angle of 138°. (C) Overlapped axial CT images of tibial plateau and tibiofibular distal joint. The tibial torsion angle is 34°.

Fig. 22: Case 5. Patient sent for coronal and axial alignment assessment of the left lower limb. (A) Overlapped axial CT images of the femoral neck and distal femur showing a femoral anteversion of 15.4°. (B) Overlapped axial CT images of distal femur and proximal tibia (patellar tendon insertion) in which a TT-TG of 1.19cm and a sulcus angle of 149° are appreciated. (C) Overlapped axial CT images of tibial plateau and distal tibiofibular joint show a tibial torsion angle of 40.9°.

Fig. 23: Case 6. 49 years old female with long standing right anterior knee pain. The axial CT images and limb alignment study with a right sulcus angle of 155° and left angle of 149°. Right TT-TG distance is 13mm, left TT-TG distance is 11 mm. In this case, the patellofemoral syndrome is multifactorial due to trochlear dysplasia and lower limb malalignment.

Fig. 24: Case 6 (continued). Patellar height measured with Caton Deschamps index was 1.1 (not shown), so it didn´t contribute to patellofemoral syndrome. Sagittal CT image (C) and fat sat T2 weighted image (D) show patellar osteophytes and a supratrochlear spur (White arrow) and patellar cartilage abnormality (blue arrow).

Fig. 25: 7 years old kid with right knee pain and lower limbs length and morphology asymmetry. Anteroposterior and lateral radiographies of the right knee (images A and B) show femorotibial subluxation (Compare with left knee, images C and D). The arrows show asymmetrical patellar ossification.

Fig. 26: Case 7 (Continued). Axial tomography image (E) exhibit chronic patellofemoral dislocation. Trochlear Groove is not seen. Femoral anteversion angle and TT-TG distance are decreased. These features are mainly secondary to chronic dislocation. Soft tissues must be assessed.

Fig. 27: Case 7. (Continued). Coronal and sagittal T1 weighted images (H and I respectively) show medial discoid meniscus (White arrows) and axial fat sat T2 weighted image (K) shows medial retinaculum hyperlaxity and lateral patellofemoral luxation (blue arrows). Each imaging method contributed to the complete diagnosis of multifactorial a patellofemoral syndrome.
In summary, each imaging technique contribute to the evaluation of the patellofemoral instability predisposing factors.
