ESCR 2014 / 472
MRI measurement of airway soft tissues parameters in obese patients with and without obstructive sleep apnea
Congress:
ESCR 2014
Poster Number:
472
Type:
Scientific Poster
Keywords:
Head and neck, MR, Experimental investigations, Metabolic disorders
Authors:
E. Butorova, D. Ustyuzhanin, R. Bakhtiozin, M. Shariya; Moscow/RU
DOI:
DOI-Link:

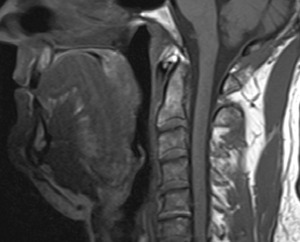
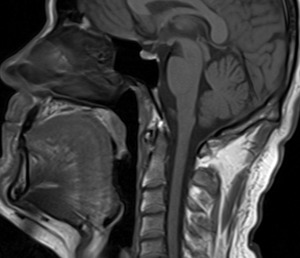
Fig. 1:
Midsagittal MR image in patient with OSAS. MRI showed increase of tongue and...

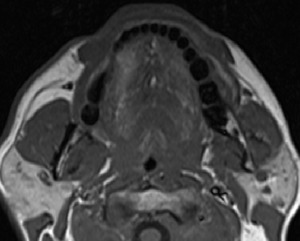
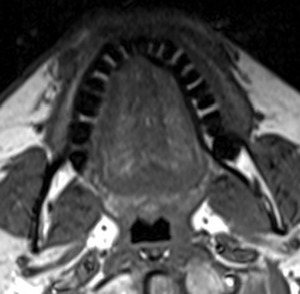
Fig. 2:
Axial MR image at retropalatal region in patient with OSAS. MRI showed increase...

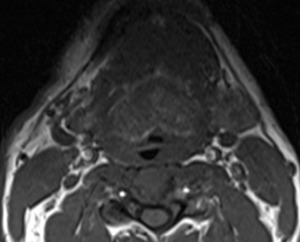
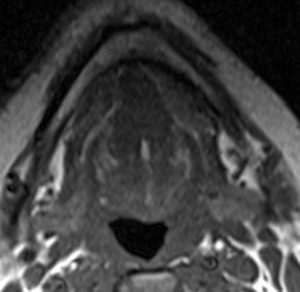
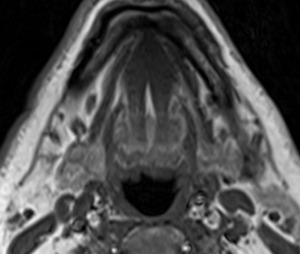
Fig. 3:
Axial MR image at retroglossal region in patient with OSAS. MRI showed an...

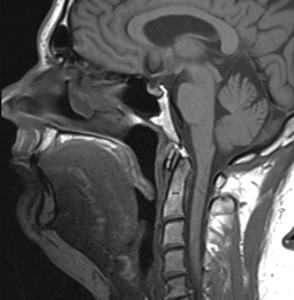
Fig. 4:
Midsagittal MR image in obese patient without OSAS. MRI showed significantly...

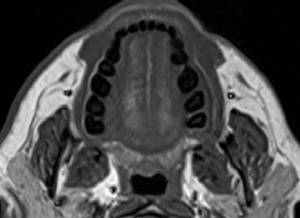
Fig. 5:
Axial MR image at retropalatal region in obese patient without OSAS. MRI showed...

Fig. 6:
Axial MR image at retroglossal region in obese patient without OSAS. MRI showed...