Current challenge in diabetic foot
MR imaging is the modality of choice for the evaluation of bone and soft-tissue infection in diabetic foot,
the diagnostic is feasible when is observed low signal intensity on T1-weighted images in bone marrow adjacent to ulceration at predictable sites (1,
2).
However when in addition there is early stage of Charcot neuro-osteoarthropathy (CN) or recent surgical changes,
diagnosing diabetic foot osteomyelitis (DFO) and evaluating the extension is unfortunately difficult.
Examples with feasible diagnostic and with difficult diagnostic of DFO on MRI in Figure 1
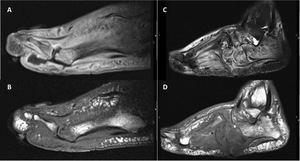
Fig. 1: Diagnostic of DFO on MRI .
A and B, Feasible diagnostic of DFO in a 45-year-old man (case 3) with type 2 diabetes, in insulin treatment and with peripheral neuropathy, presents an infected ulcer in the plantar aspect of the forefoot. A, Sagittal T1-weighted TSE image with fat saturation and contrast shows enhancement of bones and soft-tissue, with a sinus tract in soft tissue extending from the plantar ulcer to the 1st metatarsophalangeal joint. B. Sagittal T1-weighted SE image showing low signal intensity in the head of the 1st metatarsal corresponding to osteomyelitis.
C and D, Difficult diagnostic of DFO in a 57-year-old man (case 4) with type 2 diabetes, in insulin treatment, with peripheral neuropathy and Charcot neuro-osteoarthropathy, presents an infected ulcer in plantar aspect of the midfoot. A, Sagittal T2-weighted TSE image with fat saturation showing the plantar ulcer and signal change in several bones of the midfoot, calcaneus and metatarsal bones. B. Sagittal T1-weighted SE image showing a low signal intensity with the “ghost-sign” in cuboid bone reflecting DFO. However, there were many other bones with the “ghost-sign, making it difficult to assess the real extension of the infection.
Role of the Functional MRI in diabetic foot
DCE-MRI has proved useful in differentiating edema from bone infection in other areas (3).
Application of functional techniques as dynamic contrast-enhanced (DCE) MRI has been proposal that may play an important role in diabetic foot with osteomyelitis (4),
although there are no specific studies and a quantitative assessment of physiologic parameters has not been yet standardized.
The analysis of data include monocompartimental model (it consider the movement of contrast agent from artery to vein) and bicompartimental model (it consider an extravascular and extracellular space with leakage and recirculation of the contrast agent from and into capillaries),
with three general approaches (5):
1.
Visual assessment of the time-intensity curve (TIC)
(monocompartimental model),
easy to obtain from a region of interest.
Rijswijk CSP et al (6) propose 5 patterns of TIC:
|
 Type I Type I
|
No enhancement
|
|
Type II
|
Gradual increase in enhancement
|
|
Type III
|
Rapid initial enhancement followed by a plateau phase
|
|
Type IV
|
Rapid initial enhancement followed by a washout phase
|
|
Type V
|
Rapid initial enhancement followed by sustained late enhancement
|
TIC type II has been proposed in CN and type V in inflammatory events and DFO (4,7).
Type intensity curves (TIC) of DCE-MRI in Figure 2
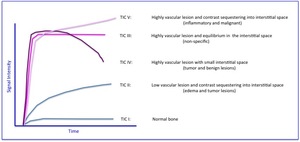
Fig. 2: Type intensity curve (TIC) patterns in DCE-MRI and the corresponding tissue lesion described in the literature.
2.
Semiquantitative approach (monocompartimental model),
analysing
the signal intensity through parametric map involves:
- Maximum (relative) enhancement,
time to maximum signal intensity,
time to peak,
rate of peak,
rate of enhancement,
T90 and maximum rate of change of enhancement,
are dependent on the MRI protocol chosen or the contrast agent,
and are not a measure of intrinsic physiological properties.
- Initial area under the time-concentration curve (iAUC),
is a model‐free parameter describing the uptake of contrast agent in a tissue,
derived directly only from the curve intensity signal.
It represents a mixture of microcirculatory and tissue proprieties,
with the advantages that it is robust and independent of injection protocols.
3.
Quantitative assessment using pharmacokinetic models (PKM)
(bicompartimental model) permits the extraction of physiologically
relevant quantities that reflect intrinsic properties of the tissue.
Baseline
T1 signal,
contrast agent concentration and arterial input fraction (AIF)
calculation are required.
PKM parameters
|
Ktrans
(min-1)
|
Volume transfer constant (or coefficient) between blood plasma and extravascular extracellular space (EES)
VASCULAR PERMEABILITY
|
|
Ve
(%)
|
Volume of EES per unit volume of tissue
EXTRACELLULAR VOLUME FRACTION
|
|
Kep
(min-1)
|
Rate constant between EES and blood plasma (backflux exchange rate) (Keρ= Ktrans/Ve)
|
|
iAUC
|
Initial area under the time‐concentration curve (model‐free parameter describing the uptake of contrast agent in a tissue)
|
Tissue models and approach to DCE-MRI parameters in Figure 3
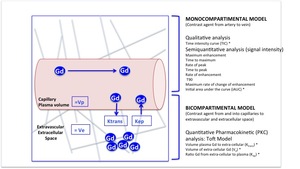
Fig. 3: Tissue models analyzing DCE-MRI parameters
In blue, representation of the perfusion of gadolinium in the tissues, which is only present in plasma and extracellular space.
*Parameters evaluated in this study by its their feasibility, robustness or biological relevance
OUR AIM was to study the DCE-MRI usefulness and their optimal parameters,
including models with adequate reproducibility (TIC,
iAUC and PKM) for differentiating between DFO and bone oedema in CN,
as a previous step to apply it in difficult cases.

 with type 2 diabetes, in insulin treatment and with peripheral neuropathy, presents an infected ulcer in the plantar aspect of the forefoot. A, Sagittal T1-weighted TSE image with fat saturation and contrast shows enhancement of bones and soft-tissue, with a sinus tract in soft tissue extending from the plantar ulcer to the 1st metatarsophalangeal joint. B. Sagittal T1-weighted SE image showing low signal intensity in the head of the 1st metatarsal corresponding to osteomyelitis.
C and D, Difficult diagnostic of DFO in a 57-year-old man (case 4) with type 2 diabetes, in insulin treatment, with peripheral neuropathy and Charcot neuro-osteoarthropathy, presents an infected ulcer in plantar aspect of the midfoot. A, Sagittal T2-weighted TSE image with fat saturation showing the plantar ulcer and signal change in several bones of the midfoot, calcaneus and metatarsal bones. B. Sagittal T1-weighted SE image showing a low signal intensity with the “ghost-sign” in cuboid bone reflecting DFO. However, there were many other bones with the “ghost-sign, making it difficult to assess the real extension of the infection.")
 patterns in DCE-MRI and the corresponding tissue lesion described in the literature.")
