Bones with osteomyelitis showed significant values of ktrans and iAUC significantly higher than those of CN,
both small and large ROIs and for both readers (P<0.05).
The reliability was from good to excellent in iAUC between different ROI sizes and pathological conditions (0.74-0.92) and only between large ROIs in evaluating ktrans (0.87-0.9),
being poor or moderate between small ROIs or using both ROI sizes in ktrans(0.43-0.69).
The cut-off values to discriminate DFO of the significant variables with the best reliability and specificity were for large ROIs in ktrans 0.1140 (sensitivity 72.7%,
specificity 84.1%) (AUC 0.830,
P=0.001) and iAUC from 3.318 to 5.976 (sensitivity 90.9% to 72.7%,
specificity 70.5% to 86.4%,
respectively) (AUC 0.820,
P=0.001).
Differences,
reliability and cut-off values of DCE-MR parameters in Figures 6 and 7.
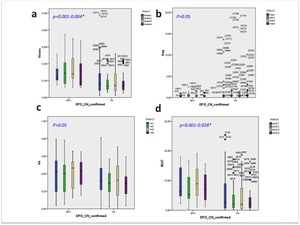
Fig. 6: Box-plots show DCE-MRI (a, Ktrans; b, Ve; c, Kep; d, iAUC ) values in diabetic foot osteomyelitis (DFO) and Charcot neuro-osteoarthropathy (CN), and range of significant differences between readers and sizes of ROIs (*).
Charts colors: blue, first reader small ROI; green, first reader large ROI; yellow, second reader small ROI; purple, second reader large ROI.
Bones with DFO showed significant higher Ktrans and iAUC values than bones with CN for both sizes of ROIs and readers. Outliers are showed.
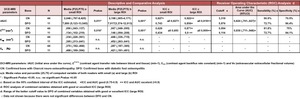
Fig. 7: Analysis of the quantitative DCE-MRI parameters: Description and comparative analysis between bones with DFO and CN, Intraclass correlation coefficient (ICC) between both sizes of ROIs and readers, and ROC analysis to propose a cutoff value to diagnose DFO.
TIC pattern considering all ROIs and readers,
in DFO was II in 43.2% and III or V in 56.8%,
CN was II or I in 86.9% and III or V in 13% of bones.
No bone with DMO showed a TIC I,
and only 2.8% of cases with CN showed a TIC III.
The reliability was from good to excellent between all sizes and conditions evaluating the TIC pattern (Kappa: 0.77-0.93) and only moderate between large ROIs in the bones with CN (0.60).
Although the small ROIs presented a better reliability,
the evaluation with large ROIs showed a better agreement (kappa 0.471 in large FOV,
0.398 in small FOV,
both P=0.000).
TIC type I or II model as CN and type III or V as DFO,
it showed a moderate agreement (kappa 0.432,
P=0.000) with good specificity (87.5%) and VPN (89%) although with sensibility (56.8%) and VPP (53.2%) moderate,
proving to be a test of frequently to sometimes useful (Positive Likelihood 5.3,
Negative Likelihood 0.51).
TIC patterns of the DCE-MRI in confirmed bones with DFO and CN,
agreement and reliability in Figures 8 and 9.
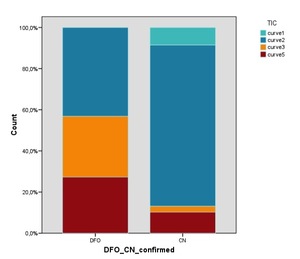
Fig. 8: Bar charts show the percentage of the different TIC patterns in osteomyelitis (DFO) and Charcot neuro-osteoarthropathy (CN), The curve type I was only observed in CN. Curve type II was observed in both pathologies, although mainly in CN. Curve type III was present principally in DFO and only in some cases of CN. Curve type V was present in both pathologies, although more often in DFO.
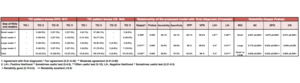
Fig. 9: Analysis of the TIC pattern in DCE-MRI:
Description of the observed TIC according to the size of the ROIs and readers for the bones with DFO and CN, relationship analysis of the proposed model (TIC I and II as CN, and III and V as DFO) with the final diagnosis, and study of reliability between both ROIs and readers.
DCE-MRI study: Cases with DFO and CN in Figures 10 and 11.
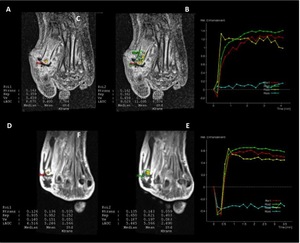
Fig. 10: Diabetic foot osteomyelitis (DFO).
A-C, 53-year-old man (case 10) with type 2 diabetes, insulin treatment and peripheral neuropathy, presented infected ulcer in the medial aspect of the forefoot with osteomyelitis in 1st metatarsal. A and B. Axial T1-VIBE3D DCE-MRI show small ROI (A) and large ROI (B) sampled in the 1st metatarsal bone, and PKM parameters show Ktrans values > 0.114 and iAUC > 5.976 (specificity 81.8% and 86.4%, respectively), corresponding to DFO. C, TIC of the DCE-MRI show a fast and progressive enhancement (type V) in the infected bone in small ROI (red curve) and in large ROI (green curve) (vessel in yellow and normal bone in blue).
D-F. 45-year-old man (case 3) with type 2 diabetes, insulin treatment and peripheral neuropathy, presented infected ulcer in lateral aspect of the forefoot and osteomyelitis in the head of the 5th metatarsal. D and E, Axial T1-VIBE3D DCE-MRI show small ROI (D) and large ROI (E) sampled in the 5st metatarsal bone, and PKM parameters show Ktrans values > 0.114 and iAUC > 3,318 (specificity 81.8% and 70.5%, respectively), corresponding to DFO, although with lower specificity in the iAUC value than the previous case. F, TIC of the DCE-MRI show a fast enhancement followed by a plateau phase (type III) in the infected bone in small ROI (red curve) and in large ROI (green curve) (vessel in yellow and normal bone in blue).
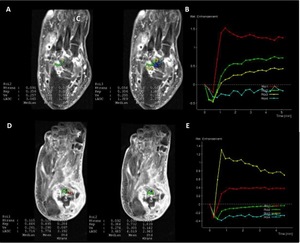
Fig. 11: Charcot neuro-osteoarthropathy (CN).
A-C, 60-year-old man (case 5 ) with type 2 diabetes, insulin treatment, peripheral neuropathy and Charcot neuro-osteoarthropathy (CN). A and B, Small ROI (A) and Large ROI (B) in the talus bone with oedema due to CN, PKM parameters show Ktrans values < 0.114 and iAUC < 3,318, corresponding to CN in both ROIs. C, TIC of the DCE-MRI show a slow and progressive enhancement (type II) in small ROI (green curve) and large ROI (yellow curve) (vessel in red and normal bone in blue).
D-F, 47-year-old woman (case 17 ) with type 2 diabetes, insulin treatment, peripheral neuropathy and Charcot neuro-osteoarthropathy (CN). D and E, ROIs in the talus bone with oedema due to CN, PKM parameters show Ktrans values < 0.114 corresponding to CN, but iAUC values were between 3,318 and 5.976 as DFO. F, TIC of the DCE-MRI show a slow enhancement (type II, although followed by a plateau phase) in small ROI (red curve) and slight in large ROI (green curve) (vessel in yellow and normal bone in blue).

 values in diabetic foot osteomyelitis (DFO) and Charcot neuro-osteoarthropathy (CN), and range of significant differences between readers and sizes of ROIs (*).
Charts colors: blue, first reader small ROI; green, first reader large ROI; yellow, second reader small ROI; purple, second reader large ROI.
Bones with DFO showed significant higher Ktrans and iAUC values than bones with CN for both sizes of ROIs and readers. Outliers are showed.")
 between both sizes of ROIs and readers, and ROC analysis to propose a cutoff value to diagnose DFO.")
 and Charcot neuro-osteoarthropathy (CN), The curve type I was only observed in CN. Curve type II was observed in both pathologies, although mainly in CN. Curve type III was present principally in DFO and only in some cases of CN. Curve type V was present in both pathologies, although more often in DFO.")
 with the final diagnosis, and study of reliability between both ROIs and readers.")
.
A-C, 53-year-old man (case 10) with type 2 diabetes, insulin treatment and peripheral neuropathy, presented infected ulcer in the medial aspect of the forefoot with osteomyelitis in 1st metatarsal. A and B. Axial T1-VIBE3D DCE-MRI show small ROI (A) and large ROI (B) sampled in the 1st metatarsal bone, and PKM parameters show Ktrans values > 0.114 and iAUC > 5.976 (specificity 81.8% and 86.4%, respectively), corresponding to DFO. C, TIC of the DCE-MRI show a fast and progressive enhancement (type V) in the infected bone in small ROI (red curve) and in large ROI (green curve) (vessel in yellow and normal bone in blue).
D-F. 45-year-old man (case 3) with type 2 diabetes, insulin treatment and peripheral neuropathy, presented infected ulcer in lateral aspect of the forefoot and osteomyelitis in the head of the 5th metatarsal. D and E, Axial T1-VIBE3D DCE-MRI show small ROI (D) and large ROI (E) sampled in the 5st metatarsal bone, and PKM parameters show Ktrans values > 0.114 and iAUC > 3,318 (specificity 81.8% and 70.5%, respectively), corresponding to DFO, although with lower specificity in the iAUC value than the previous case. F, TIC of the DCE-MRI show a fast enhancement followed by a plateau phase (type III) in the infected bone in small ROI (red curve) and in large ROI (green curve) (vessel in yellow and normal bone in blue).")
.
A-C, 60-year-old man (case 5 ) with type 2 diabetes, insulin treatment, peripheral neuropathy and Charcot neuro-osteoarthropathy (CN). A and B, Small ROI (A) and Large ROI (B) in the talus bone with oedema due to CN, PKM parameters show Ktrans values < 0.114 and iAUC < 3,318, corresponding to CN in both ROIs. C, TIC of the DCE-MRI show a slow and progressive enhancement (type II) in small ROI (green curve) and large ROI (yellow curve) (vessel in red and normal bone in blue).
D-F, 47-year-old woman (case 17 ) with type 2 diabetes, insulin treatment, peripheral neuropathy and Charcot neuro-osteoarthropathy (CN). D and E, ROIs in the talus bone with oedema due to CN, PKM parameters show Ktrans values < 0.114 corresponding to CN, but iAUC values were between 3,318 and 5.976 as DFO. F, TIC of the DCE-MRI show a slow enhancement (type II, although followed by a plateau phase) in small ROI (red curve) and slight in large ROI (green curve) (vessel in yellow and normal bone in blue).")