Let's begin by an example case:
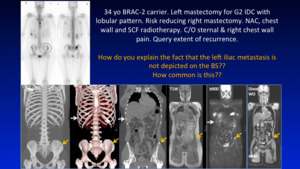
Fig. 2: case
References: Professor Anwar Padhani
Is this appearance unusual?
Not really,
it is seen quite often in day to day oncological imaging.
Why?
The apperances of bone metastases really depends on the degree of cellularity and sclerosis associated with that tumour type. We highlight 7 patterns of bone metastasis on imaging,
their individual pattern,
likely tumour phenotypes and hypothesise the potential causes for this.
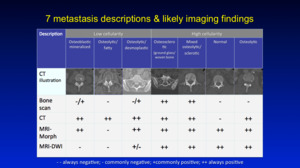
Fig. 1: Summary
References: Professor Anwar Padhani
Is this important?
Well it is if you care to consider why various bone metastases have a reduced sensitivity to detection on different imaging modalities.
Fig. 1 above demonstrates this point, where low cellularity purely Osteolytic types such as in the case of Multiple Myeloma,
are best depicted on CT and poorly detected on other imaging modalitites.
On the contrary highly cellular lesions such as in breast and prostate cancer are best depicted on MRI (Morphological and DWI),
but these too have CT+ve (Osteolytic) and CT-ve (Normal appearance) subtypes.
Why do we see these patterns on different imaging techniques?
First,
we need to understand that the biology being depicted by imaging varies depending on the imaging technique used:
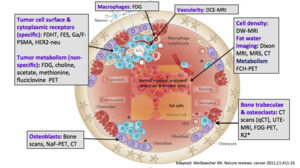
Fig. 3: Biology
References: Weilbaecher KN. Nature reviews: cancer 2011;11:411-2
Marrow cellularity imaging is superior with Diffusion weighted imaging,
Fat-Water imaging techniques is best done with Gradient-echo techniques such as the Dixon technique (MR spectroscopy doesn't allow high resolution imaging).
If the interest lies with Bone,
then CT scans are preferrential amongst other techniques such as Ultrashort TE MRI (UTE-MRI).
Note that Osteoclasts consume FDG so PET scans indirectly indicate their activity.
Osteoblastic activity is best depicted with Bone scans,
NAF-PET-CT.
If the interest lies with Tumour/malignant cell activity,
Generic tumour PET metabolism markers such as FDG,
Choline,
Fluciclovine may be used.
If the interest lies with more cell specific receptor imaging,
you can use
F-DHT,
FES,
Ga/F-PSMA.
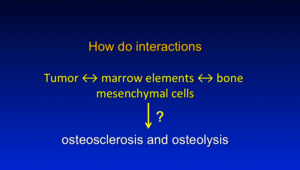
Fig. 5: Question
References: Professor Anwar Padhani
So what are the interactions between the tumour cells,
the marrow cells and the bone stromal cells that eventually cause osteolysis and osteosclerosis?
Molecular mechanisms
Fig. 6 below demonstrates and summarises the regulation of osteoblastic and osteoclastic activity in bone.
In many types of metastases there is a spectrum of actvity with varying degrees of osteosclerosis and osteolysis depending on the amount of OPG and RANKL; whose action is mediated via cyctokines.
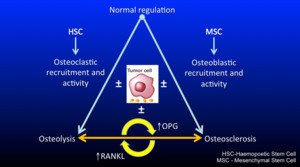
Fig. 6: Schematic
References: Professor Anwar Padhani
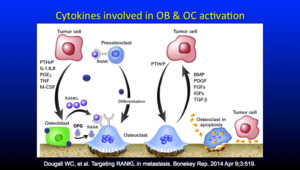
Fig. 7: cytokines involved
References: Dougall WC, et al. Targeting RANKL in metastasis. Bonekey Rep. 2014 Apr 9;3:519.
Fig. 8 Demonstrates signalling in further detail.
The sclerotic metastasis type with tumour cells seen at the periphery undergo osteoclastic recruitment and activity either directly or via 4 indirect mechanisms,
resulting in varying degrees of osteoblastic/osteoclastic differentiation.
These pathways are either upregulated or down regulated thus affecting the OPG and RANKL ratio.
As the levels of OPG/RANKL ratio can change over time,
so the phenotype of metastases also changes.
Figure 8 showns as previously predominantly osteoblastic processes resulting in 'sclerotic' appearance change over time,
change to more osteoclastic dominant pathways,
resulting in a more 'lytic' appearance (note the unchanged level in serum PSA - prostate specific antigen).
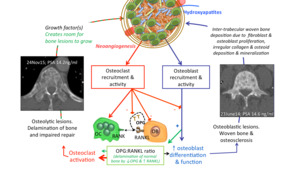
Fig. 8: pathways
References: Professor Anwar Padhani
Cancer-initiating cells in the marrow space co-opt molecular processes leading to bone metastases formation and expansion. Wnt/ET axis/BMP pathway signaling is the key osteoblast regulatory pathway,
which is critical for osteoblast differentiation and function and the development of osteosclerotic metastases.
Osteoblast commitment,
proliferation and differentiation coupled with osteoblast production of type I collagen and the subsequent mineralization of osteoid forms the calcified matrix of woven bone.
Prostate metastases also display osteolytic activity via changes in OPG/RANKL ratio resulting in persistent osteoclastic resorption at the edge of sclerotic lesions. The persistent edge of osteolysis of cancer metastases helps to debulk bone,
thereby promoting adjacent expansion by the release of growth factors within trabeular bone.
Dickkopf homologue 1 (DKK-1) is a protein that regulates bone metastasis progression by opposing the actions of osteogenic Wnts and by directly influencing the balance between osteolysis and osteosclerosis.
The primary effect of DKK-1 appears to be the disruption of the differentiation of mesenchymal stem cells to osteoblasts.
Metastatic cancer cells secretion of elevated levels of DKK-1 lowers OPG levels resulting in reduced bone formation. In addition,
DKK-1 enhances RANKL levels,
thus increasing RANKL/OPG ratio,
which activates osteoclast activity,
leading to normal and malignant bone resorption.
The spine CT scans inserts are from the 2 time points indicated,
from a 68 year old male with metastatic prostate cancer. Osteosclerotic metastases (with small areas of osteolysis) (June 2014: PSA 14.6 ng/mL) in the L4 vertebral body,
treated with enzalutamide (September 2014: PSA nadir 1.7 ng/mL). Osteolysis occurs in the lower thoracic spine with tumour progression in November 2015 (PSA 14.2 ng/mL).
It is these interactions between these cells which results in the
'Magnificent 7' distinct imaging phenotypes.
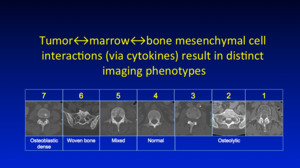
Fig. 4: imaging phenotypes
References: Professor Anwar Padhani
The table below,
summarises these imaging phenotypes on CT/BS and MRI,
as well as the Tumour types associated with them.
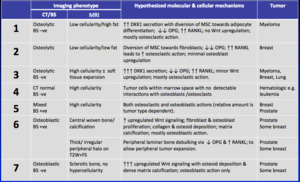
Fig. 9: summary
References: Professor Anwar Padhani
Starting with Pattern 1,
osteolytic and fat filled lesions commonly seen in Multiple Myeloma:
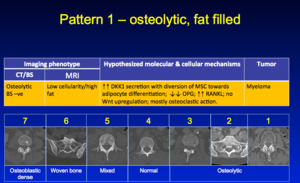
Fig. 10: Pattern 1
References: Professor Anwar Padhani
Here is an example with morphological T1W and T2W of the whole spine and selected axial images,
Inverted MIP b900 images in the centre and CT slices on the botton right.
Here a few cells cause a lot of osteolysis,
due to an amplified cytokine mediated effect
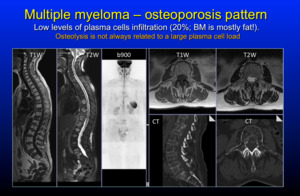
Fig. 11: Pattern 1
References: Professor Anwar Padhani
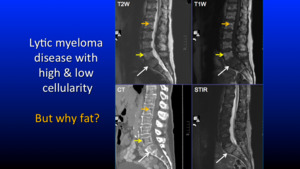
Fig. 12: Pattern 1
References: Professor Anwar Padhani
So why does fat accumulate in these spaces? The below schematic Fig. 13 demonstrates the pathways involved.
DKK1 which strongly influences the osteoblastic deactivation and diversion of progenitor mesenchymal stem cells towards fat differention resulting in marrow adipogenesis.
Osteolysis is due to direct osteoclastic activation via OPG/RANKL ratio alterations.
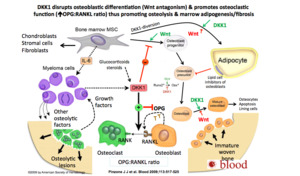
Fig. 13: DKK1
References: Pinzone J J et al. Blood 2009;113:517-525
Pattern 2 - osteolytic with fibrosis is uncommon but relatively low cellularity/low fat.
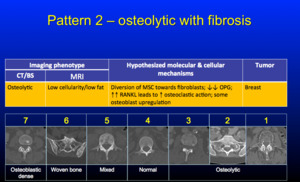
Fig. 14: Pattern 2
References: Professor Anwar Padhani
Below is an example case with whole body inverted MIP b900 to the left,
DWI,
Fat% and CT images demonstrating the pattern 2 phenotype.
The low cellualrity region is presumed to contain fibrosis,
arising from the activation of cancer related fibroblasts.
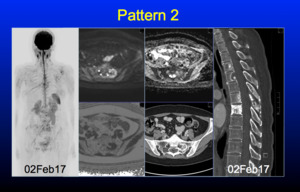
Fig. 15: Pattern 2
References: Professor Anwar Padhani
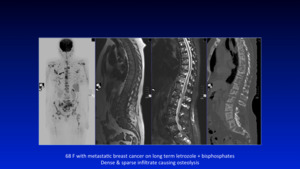
Fig. 16: Pattern 2
References: Professor Anwar Padhani
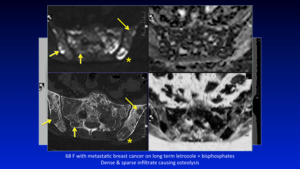
Fig. 17: Pattern 2
References: Professor Anwar Padhani
Pattern 3 - refers to pure osteolytic lesions with highly cellular marrow,
commonly seen with Myeloma,
Lung and Breast cancer.
There is little osteosclerosis visible.
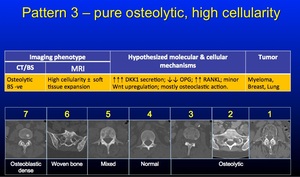
Fig. 18: Pattern 3
References: Professor Anwar Padhani
The example below of a 70 year old female with a grade 2 invasive ductal carcinoma of the breast,
ER positive and HER-2 negative.
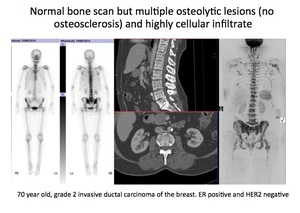
Fig. 19: Pattern 3
References: Professor Anwar Padhani
(Left 2 panels) Planar bone scan showing no abnormalities to suggest bone metastases.
(Middle 2 panels) Multiplanar and 3D reconstructed CT scan with contrast medium administration showing multiple small osteolytic lesions (best seen on the axial image,
with no associated sclerosis.
(Right 2 panels) Morphological (T1 weighted) and projection b900 diffusion weighted MRI scan showing widespread metastatic disease in the axial skeleton including proximal humeri,
femora,
pelvis,
spine and ribs.
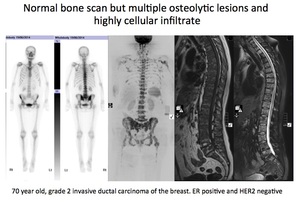
Fig. 20: Pattern 3
References: Professor Anwar Padhani
We see predominantly osteolytic lesions,
which cannot be appreciated at all on the bone scan (negative),
yet extensive marrow infiltration is depicted on the diffusion weighted imaging. This is a typical pattern of mainly osteolysis,
with very little osteosclerosis,
thus the pathway of osteoclastic activaity is hyperactivated Fig. 21 .
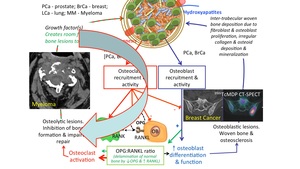
Fig. 21: Pattern 3
References: Professor Anwar Padhani
Pattern 3 demonstrates how multiparametric imaging enables an improved understanding of the biological processes driving the patient's disease.
This improved understanding also allows us to know which is the best technique to assess response to therapy.
Pattern 4 - refers to highly cellular marrow without detectable bone change on CT scans and commonly found in haematologic malignancy,
but is not unusual in breast cancer and myeloma.
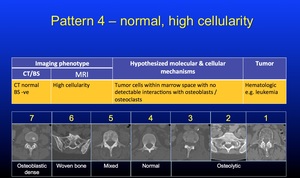
Fig. 22: Pattern 4
References: Professor Anwar Padhani
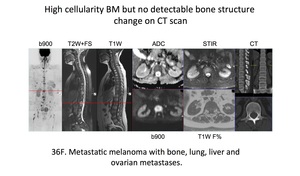
Fig. 23: Pattern 4
References: Professor Anwar Padhani
Pattern 5 has characteristics of patterns 4 and 6.
There is intermixing of normal bone,
mineralised bone and osteolysis.
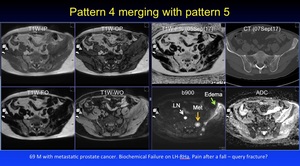
Fig. 24: Pattern 4
References: Professor Anwar Padhani
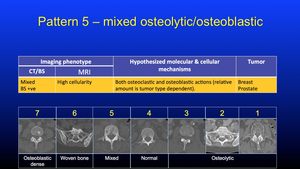
Fig. 25: Pattern 5
References: Professor Anwar Padhani
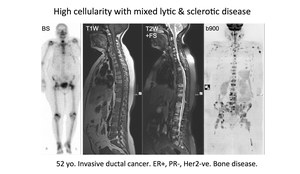
Fig. 26: Pattern 5
References: Professor Anwar Padhani
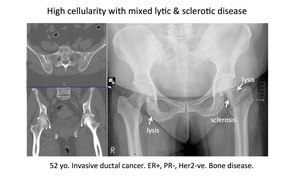
Fig. 27: Pattern 5
References: Professor Anwar Padhani
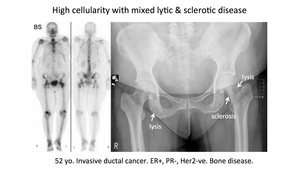
Fig. 28: Pattern 5
References: Professor Anwar Padhani
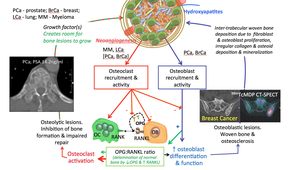
Fig. 29: Pattern 5
References: Professor Anwar Padhani
Pattern 6 are mineralised lesions which are classically seen and the most common in breast and prostate cancer.
The interactions in this subcategory produce the so called T2 'Halo' sign also known as the 'war zone' appearance,
which is the zone on high cellulaity - see below.
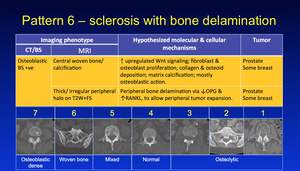
Fig. 30: Pattern 6
References: Professor Anwar Padhani
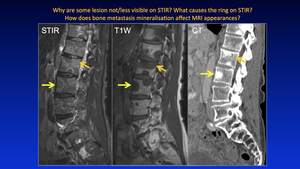
Fig. 31: Pattern 6
References: Professor Anwar Padhani
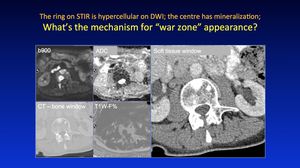
Fig. 32: Pattern 6
References: Professor Anwar Padhani
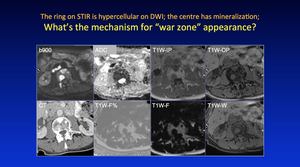
Fig. 33: Pattern 6
References: Professor Anwar Padhani
Osteoblastic recruitment results in inital mineralisation of woven bone resulting in margination of tumour cells.
Activation of the OPG/RANKL ratio results in osteoclastic activation enabling metastasis expansion.
Thus,
there develops a wave expansion of metastases which are increasily calcified in the center,
mineralised in the periphery and cellular at the margins. Fig. 34 is responsible for the 'Halo' of surrounding osteolysis,
which develops as the lesion grows over time.
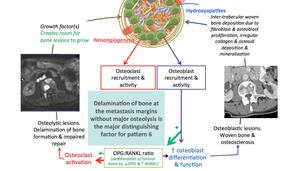
Fig. 34: Pattern 6
References: Professor Anwar Padhani
This 'Halo' is the most dense site of tumour cellular packing.
This is a classical appearance with high signal intensity seen circumferencially at the edges on DWI in this example Fig. 35 Fig. 36 as the ring like lesion progresses,
demonstrating an area of therapy resistance.
The ring of osteoclastic activity demonstrated here in the pelvis Fig. 37 around the sclerotic metastatic lesion,
is the area of higher cellularity with the centre of the lesion being the focus of central mineralisation.
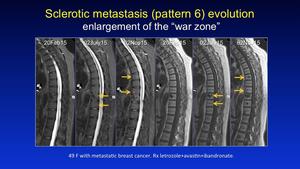
Fig. 35: Pattern 6
References: Professor Anwar Padhani
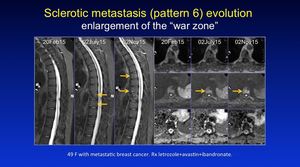
Fig. 36: Pattern 6
References: Professor Anwar Padhani
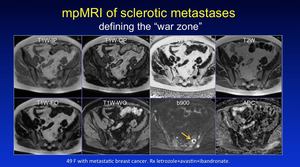
Fig. 37: Pattern 6
References: Professor Anwar Padhani
And finally,
Pattern 7 - Dense osteoblastic,
commonly in prostate and some breast cancers; these lesions are commonly seen when patients are treated with anti-osteoclastic drugs such as bisphophonates and Denosumab.
Only some of these lesions are inactive,
only DWI can inform on individual lesion activity.
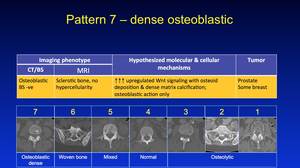
Fig. 38: Pattern 7
References: Professor Anwar Padhani
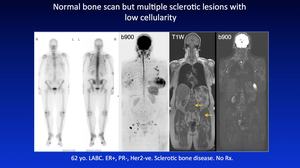
Fig. 39: Pattern 7
References: Professor Anwar Padhani
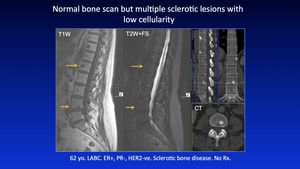
Fig. 40: Pattern 7
References: Professor Anwar Padhani


