The normal bone marrow and MR Imaging
Normal bone marrow consists primarily of three elements: a bony trabecular matrix,
myeloid tissue,
and adipose cells.
Marrow can be classified into hematopoietic (red) and fatty (yellow) types,
depending on chemical and cellular composition.
Red marrow represents the hematopoietic portion of the bone marrow,
with roughly 60% hematopoietic cells,
and consists of approximately 40% water,
40% fat,
and 20% protein.
Yellow marrow probably provides surface and/or nutritional support for the red marrow.
It contains approximately 15% water,
80% fat and 5% protein.
The proportion of myeloid and adipose cells changes with age and with the body’s demand for new red blood cells.
MRI is a highly sensitive tool for non-invasive detection of physiological and pathological marrow changes.
The MRI appearances of marrow depend on sequence selection and the relative amounts of fat and water within the marrow.
In the assessment of normal development,
the T1-weighted sequence is most widely used as fat is the major component of both red and yellow marrow and it is the more sensitive sequence in detecting signal change between fatty and hematopoietic marrow.
Hematopoietic marrow contains more cellular material,
protein,
and water and therefore has longer T1 relaxation times than yellow marrow,
which contains a higher percentage of adipose cells.
Therefore,
on T1-weighted sequences,
hematopoietic marrow has a signal intensity equal to or slightly greater than muscle,
but significantly less than fat.
Due to its high-fat content,
yellow marrow has a short T1 relaxation time compared with water and its signal follows the MR signal intensity of subcutaneous fat.
The signal intensity difference between red and yellow marrow is less apparent on fluid-sensitive images,
as yellow marrow has a low signal intensity and red marrow has minimally high signal intensity relative to muscle.
In contrast,
most marrow diseases are hyperintense on fluid-sensitive images as there is increased intracellular and extracellular water.
The effectiveness of fat-saturation techniques in younger children is often not optimal due to their small size leads to greater signal inhomogeneity.
Hematopoietic marrow is vascularized and therefore demonstrates mild gadolinium enhancement.
As there is a progressive conversion of red to yellow marrow,
this enhancement decreases with increasing age.
Yellow marrow has no significant contrast enhancement.
|
|
Hematopoietic/ Red marrow
|
Fat/ Yellow marrow
|
|
T1-weighted
|
Intermediate
|
High
|
|
T2-weighted
|
Intermediate
|
Intermediate/ high
|
|
FS T2,
STIR
|
Moderately high
|
Low
|
|
Postcontrast
|
Enhancement
|
No enhancement
|
Table 1 – MR signal characteristics of hematopoietic and fatty bone marrow.
Diffusion-weighted imaging should be used cautiously in infants and young children,
as red marrow also restricts diffusion,
even in an asymmetrical pattern.
At birth,
hematopoietic marrow is present throughout the entire skeleton.
Accordingly,
it is isointense to muscle on T1-WI and hyperintense on fluid-sensitive sequences.
Conversion from hematopoietic red marrow to yellow fatty marrow begins during the first year of life.
This progressive increase in the amount of marrow fat leads to an increase in T1-weighted signal intensity.
Red marrow should nevertheless always be isointense or have higher signal than skeletal muscle.
Any signal abnormality should warrant further investigation.
This conversion is almost complete in the appendicular skeleton by the time of skeletal maturity,
but it proceeds in the axial skeleton throughout life.
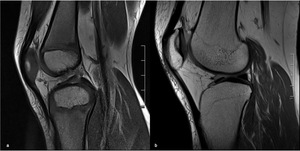
Fig. 1: MRI appearance of the knee of a 5-year old girl (a) and a 30-year-old woman (b), showing an increase of bone marrow signal intensity on T1-weighted images, due to conversion from hematopoietic red marrow to yellow fatty marrow.
Marrow conversion follows a similar pattern in both the upper and lower limbs.
It begins within the phalanges and is complete in the hands and feet by 1 year of age.
Within long bones,
epiphyseal conversion to fatty marrow occurs first,
within 6 months of the radiologic appearance of the secondary center of ossification.
It proceeds then in the diaphysis and afterward towards the metaphyses.
The last parts of the appendicular skeleton to convert are the proximal humeral and femoral metaphyses and usually have high signal intensity by 15–25 years of age.
However,
some residual low signal intensity from hematopoietic marrow may persist in the proximal femoral metaphysis,
around the knee and also within the humeral head.
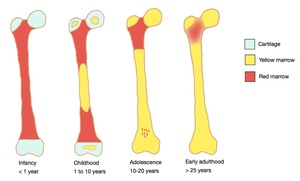
Fig. 2: The normal pattern of marrow conversion in the femur.
References: Catarina Mira
Conversion of the axial skeleton occurs at a slower rate than that of the appendicular skeleton and continues into and throughout adulthood.
Particularly in the pelvis,
marrow conversion in nonuniform,
leading to heterogeneous marrow signal intensity during the 1st decade in the anterior ilium and acetabulum.
This process continues into the 2nd decade in a heterogeneous,
although relatively symmetric fashion.
During adulthood,
residual red marrow is present in periarticular distribution predominantly around the sacroiliac joints,
the hip joints,
and the pubic symphysis.
In the late third decade of life,
the bone marrow distribution achieves its mature state.
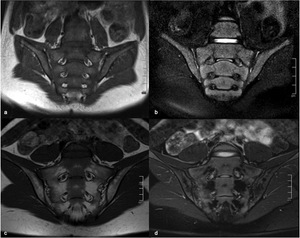
Fig. 3: MRI of the sacroiliac joints of a 6-year old boy, coronal T1 (a) and coronal FS T2 (b), and of a 14-year old girl, coronal T1 (c) and coronal FS T2 (d), showing a heterogeneous marrow signal conversion, with areas of residual red marrow in periarticular distribution, with intermediate signal both on T1 and FS T2W images.
Common pitfalls
Heterogeneous residual marrow can be found in the pediatric population,
creating areas of focal altered marrow signal that can be misinterpreted as contusions or tumor.
Important clues to the differential diagnosis include its appearance and location.
The most common location is the proximal metaphysis of the femora and humeri.
They tend to be large and geographic with a “flame-shaped” morphology,
a base adjacent to the physis and sharply defined vertical margins.
There is relative bilaterality,
no mass effect on the adjacent yellow marrow and the background trabeculation is not distorted.
In contrast,
both in contusions and tumors there is a distortion of the trabecular pattern.
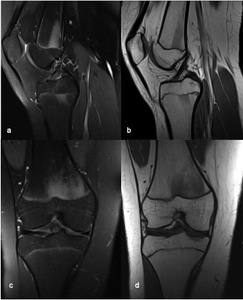
Fig. 4: MRI of the right knee of a 15-year old girl, (a) sagittal FS PD(b) sagittal T1 (c) coronal FS PD and (d) coronal T1, showing a “flame-shaped” area of focal altered marrow signal on the distal metaphysis of the femur, adjacent to the physis and with sharply defined vertical margins. There is no mass effect and no distortion of the background trabeculation.
There can also be focal bone marrow edema related to the central portion of the closing physis of the femur,
tibia,
and fibula in adolescent knees.
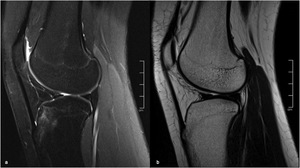
Fig. 5: MR of the right knee of a 15-year old girl, sagittal FS PD (a) and sagittal T2 (b), showing focal bone marrow edema on the anterior tibial tuberosity, probably due to the closure of the ossification center.
In a large percentage of asymptomatic children,
there are multiple scattered small foci or more extensive areas of high signal in the foot and ankle,
commonly with bilateral and symmetric involvement.
These may represent persisting perivascular islands of red marrow.

 and a 30-year-old woman (b), showing an increase of bone marrow signal intensity on T1-weighted images, due to conversion from hematopoietic red marrow to yellow fatty marrow.")

 and coronal FS T2 (b), and of a 14-year old girl, coronal T1 (c) and coronal FS T2 (d), showing a heterogeneous marrow signal conversion, with areas of residual red marrow in periarticular distribution, with intermediate signal both on T1 and FS T2W images.")
 sagittal FS PD(b) sagittal T1 (c) coronal FS PD and (d) coronal T1, showing a “flame-shaped” area of focal altered marrow signal on the distal metaphysis of the femur, adjacent to the physis and with sharply defined vertical margins. There is no mass effect and no distortion of the background trabeculation.")
 and sagittal T2 (b), showing focal bone marrow edema on the anterior tibial tuberosity, probably due to the closure of the ossification center.")