Congress:
EuroSafe Imaging 2018
Keywords:
Radiation safety, Dosimetry, CAD, CT, Radiation physics, Action 9 - Facilitation of research in advanced topics of radiation protection, Action 2 - Clinical diagnostic reference levels (DRLs), Action 7 - Medical radiation protection research: MELODI, EURAMED, Action 3 - Optimisation, diagnostic reference levels, image quality, Dosimetric comparison, Quality assurance
Authors:
M. Munier, F. CARBILLET, P. Gillet
DOI:
10.1594/esi2018/ESI-0086
Description of activity and work performed
This work concerns first the validation of IVIscan™ dosimeter to standards.
A second step provides clinical studies about comparison between the CTDI measured with IVIscan™ and displayed by CT from different manufacturer.
Based on fundamental and preliminary research with CNRS and INSERM French labs,
its first patented optical fiber detector (1,2) allows an automated and real-time measurement of patient dose and CT dose indexes (equal to the CTDI and DLP).
See the technology principle on Fig.
2.
The detector probe is based on a scintillating optical fiber that turns the absorbed X-ray into UV-visible light.
Thus,
this light is detected by integrated electronics and the resulting signal is proportional to the energy absorbed (i.e.
the dose).
Materiel and Methods
The first study aims to evaluate and calibrate the energy response of this detector in the X-ray diagnosis energy range,
and validates dose measurements on different CT protocols with phantoms against :
- pencil ionizing chamber : Radcal 10X5-3CT ;
- TLD : Harshaw LiF : Mg,
Cu,
P ;
- Monte Carlo : GATE simulation performed with SpekCalc spectra (3,4,5,6) ;
- and also the primary standard from LNHB : reference air wall chamber (technical note CEA LNHB 07/41)
Then we compared the detector dose measurements on patients with CTscan displayed CTDI and TLD measurements.
Results
Technical characterization and validation of IVIscan™
Measurements in the CT energy range (Fig.
3 top) => Good linearity response vs ionization chamber.
GATE modelization based on measured spectra (Fig.
3 bottom) => Good correlation with measurements.
Characterization of IVIscan™ response in the diagnosis energy range (20 to 150 kV) (Fig.
4) => Calibration performed for N,
RQR and RQT beams.
Clinical cases studies
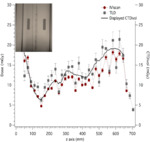
Comparison between skin dose measurements with IVIscan™,
TLD and CTDIvol displayed by CTscan (Fig.
5) => Good correlation.
Comparison between five CTDIvol displayed by IVIscan™ and CTDIvol displayed by CTscan (Table 1) => Better correlation with SSDE correction CTscan display (7).


