Scan technique, normal anatomy, and use of color Doppler
The patient lies supine on the couch. An high-resolution broadband linear array is used. The probe is placed over the closed eyelid with a small amount of contact gel. An ultrasound scan of the eye, integrated with dynamic manoeuvres of the orbit, allows obtaining morphologic, quantitative, and kinetic information about anatomy and affections of the eye.

Fig.: Normal ultrasound anatomy of the eye, axial scan. AC=anterior chamber; L=lens; I=iris; CB=ciliar body; V=vitreous humor; S=sclera; ON=optic nerve.
Color Doppler imaging is helpful to demonstrate pathologic conditions associated to an abnormal vascular perfusion and blood stream direction. Moreover, it allows measuring peak velocities and resistance index of main orbital vessels. It is suggested to apply not too much pressure on the probe, in order to avoid any modifications of blood stream.
CEUS technique
Endovenous injection of 4.8 mL of US contrast agent, followed by 10 mL of saline solution. The scan lasted up to detect a complete wash-out. We used a dedicate microconvex transducer (5-8 MHz) and US equipment provided with dedicate pulse inversion algorithms.
Choroid melanoma complicated by retinal detachment

Fig.: Choroid melanoma. Doppler evaluation performed before radiotherapy.

Fig.: Choroid melanoma scanned before radiotherapy. CEUS shows a high vascularity of the tumor.
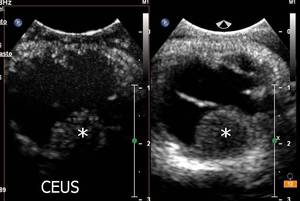
Fig.: Choroid melanoma 5 months after radiotherapy. CEUS shows a persistent vascularity, less intense compared to baseline.

Fig.: Choroid melanoma 11 months after radiotherapy. The lesion is completely avascular.
Lacrimal gland metastases
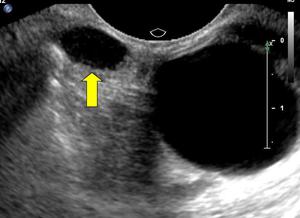
Fig.: Simil-cystic appearance of a lesion in the left lacrimal gland (arrow).
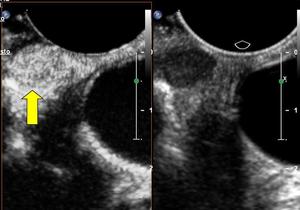
Fig.: CEUS shows an intense vascularity of the solid lesion (arrow).
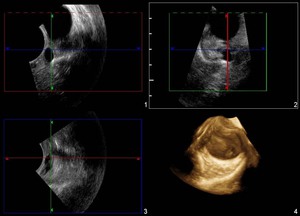
Fig.: 3D and volumetric reconstruction of previous case. This reconstruction allows a more effective representation of lesion relationship with adjacent structures.
Retinal detachment
Fig.: Temporal and nasal retinal detachment. The retina is attached to the optic nerve (ON).

Fig.: Temporal and nasal retinal detachment. The retina is attached to the optic nerve (ON).
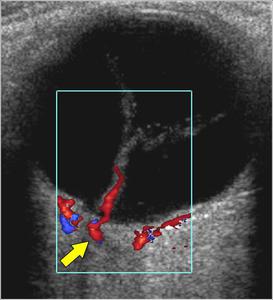
Fig.: The easiest vessel to assess are those placed at the end of the optical nerve. The ophthalmic artery (arrow) is located medially to the optical nerve and has a high resistance. The superior ophthalmic vein is located in the superomedial quadrant of the orbit and can be visualized in 90% of patients. It has a continuous bloodstream and low resistance. The inferior ophthalmic vein is less frequently seen, having a smaller calibre. Artery and central vein of the retina run parallel in the center of the distal portion of the optic nerve. The sonographic diagnosis of total detachment is generally easy since the retina remains anchored to its two fixation sites (optic nerve posteriorly and ora serrata anteriorly).
Traumatic retinal detachment
Fig.: Traumatic retinal (R) detachment associated with choroidal detachment with different arrangement of the two membranes (arrow). ON=optic nerve.

Fig.: Traumatic retinal detachment associated with choroidal (C) detachment with different arrangement of the two membranes. The retina (arrows) is vascular and connected with optic nerve.
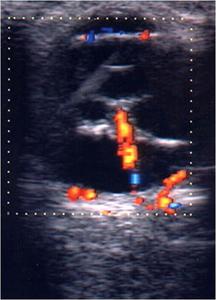
Fig.: Traumatic retinal detachment associated with choroidal detachment with different arrangement of the two membranes. The retina is vascular and connected with optic nerve.
Retinal detachment

Fig.: Hemovitreous and retinal detachment associated to vitreal membranes. B-mode imaging does not allow a precise evaluation of retinal detachment.

Fig.: CEUS in pre-perfusional phase.

Fig.: CEUS shows a rich perfusion of the retina (arrow), that can be easily distinguished by surrounding avascular membranes.
Orbital lymphoma
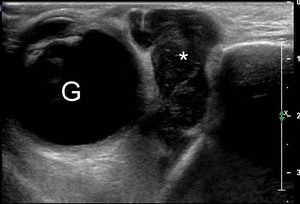
Fig.: Periorbital lesion. B-mode US shows a simil-cystic lesion (asterisk). The features and location of the lesion could lead to a diagnosis of mucocele. G=globe
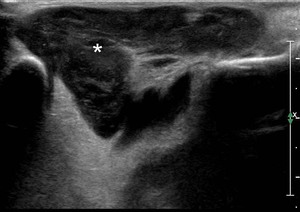
Fig.: Another B-mode scan shows a complex simil-cystic lesion (asterisk).

Fig.: Color Doppler evaluation. The lesion (asterisk) shows a poor vascularization at color Doppler analysis. G=globe.
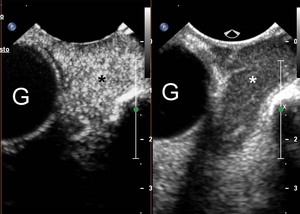
Fig.: CEUS shows a rich vascularization of the lesion (left side). G=globe.
Figure 7e: US-guided biopsy.

