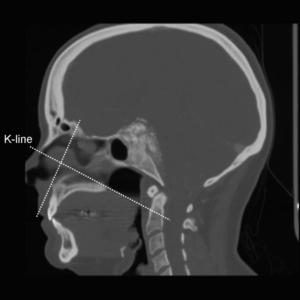
Fig.: Fig. 1. Sagittal CT reconstruction in a patient with a large calcified meningioma demonstrates the extent of rostral and caudal reach of EEA. The Kassam line (K-line), is drawn from the nasal bridge through the back of the hard palate and defines the most caudal reach of EEA.
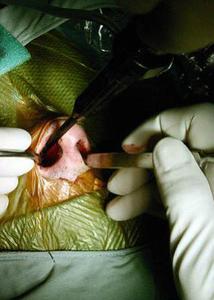
Fig.: Fig. 2. Photograph showing binarial approach.
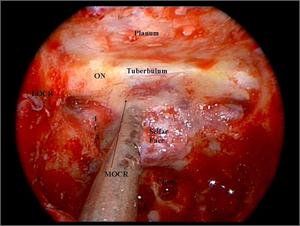
Fig.: Fig. 3. Endoscopic view following surgical exposure for sella/parasellar approach with key anatomical landmarks. ON = optic nerve; LOCR = lateral opticocarotid recess; MOCR = medial opticocarotid recess; ICA = internal carotid artery.
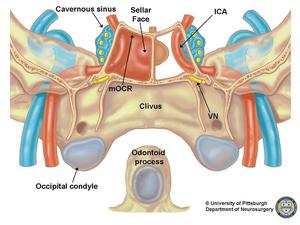
Fig.: Fig. 4. Illustration of key neurovascular structures as viewed endoscopically during surgery. mOCR=medial opticocarotid recess; ICA=internal carotid artery. Also note the vidian nerve (VN) within the vidian canal, a key anatomic landmark for resection of lesions beyond the sella/parasellar region.
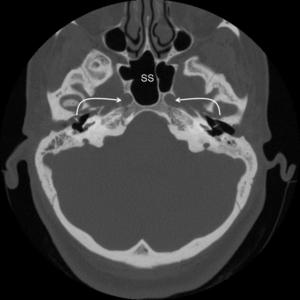
Fig.: Fig. 5A. Axial CT image shows the carotid canal containing the paraclinoid internal carotid artery (curved arrows) caudal and slightly lateral to the mOCR. SS=sphenoid sinus.
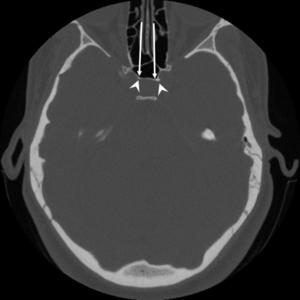
Fig.: Fig. 5B. More cranially, axial CT image illustrates the middle clinoid processes (arrowheads) immediately deep to the medial opticocarotid recesses (arrows). This relationship is key for a safe surgical approach to the sella/parasellar region.
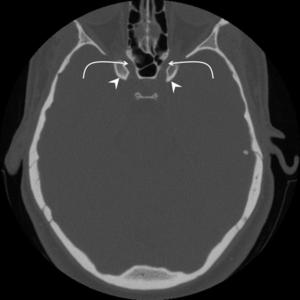
Fig.: Fig 5C. Further cranially, axial CT image shows the optic canals (curved arrows) superior to the mOCR. Anterior clinoid processes (arrowheads) are also seen.
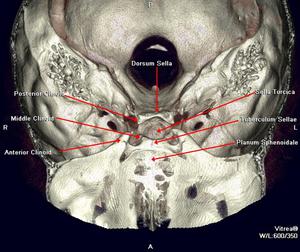
Fig.: Fig. 6. 3D volume-rendered image of the osseous skull base as viewed from above. Note the relationship of the middle clinoid process, which lies deep to the mOCR.
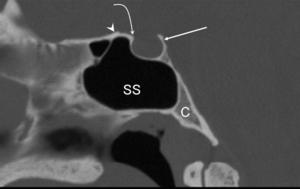
Fig.: Fig. 7. Sagittal CT reconstruction image illustrates the anatomic relationship of the planum sphenoidale (arrowhead), tuberculum sellae (curved arrow) and dorsum sellae (straight arrow). SS=sphenoid sinus, C=clivus
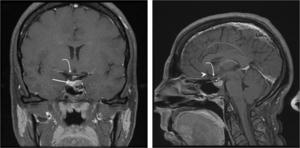
Fig.: Fig. 8. Coronal and sagittal post-contrast T1-weighted MR images illustrate neurovascular anatomy of the skull base in a patient with a left inferior pituitary microadenoma (asterisk). The pituitary gland (white arrow) and infundibulum (thin arrow) are minimally displaced, and the anterior cerebral arteries (arrowhead) and optic chiasm (curved arrow) are nondisplaced.
