Patterns of the diffusion-weighted images and the apparent diffusion coefficient maps
In the patients with global brain injury, there were three different patterns of ADC decrease. We have defined these patterns, as a predominantly decreased ADC in the cerebral cortical area (pattern I), a decreased ADC in both the cerebral cortex and WM and a predominant decrease in the cerebral WM (pattern II), and a predominantly decreased ADC in only the cerebral WM (pattern III). Figure 1 show these patterns of the DWI and the ADC map.
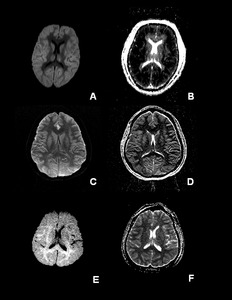
Fig.: Figure 1. Patterns of accentuated gray-white differentiation on the diffusion-weighed image (DWI) and the apparent diffusion coefficient (ADC) map.
Pattern I: A (DWI) and B (ADC map) in a 65-year-old man (case 1); Pattern II: C (DWI) and D (ADC map) in a 38-year-old woman (case 11); Pattern III: E (DWI) and F (ADC map) in a 68-year-old man (case 20). Both patterns II and III have a ‘T2- like ADC map’, but different diffusion-weighted imaging.
Table 1 shows the patterns of the ADC decreases, the etiology, the time intervals between the brain insult and obtaining the MR images, the MR angiography and the prognosis or the final neurologic status for the patients with global brain injury.
Patterns I showed a decreased ADC and diffuse high signal intensity mainly in the cerebral cortical area (figure 2).
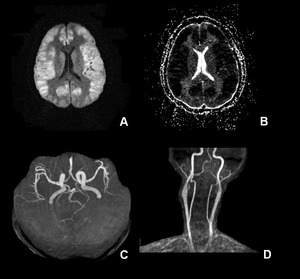
Fig.: Figure 2
A 53-year-old woman (case 6) underwent MR imaging 14 hours after septic shock. The DWI (A) and ADC map (B) shows pattern I. Intracranial (C) and neck (D) MR angiography demonstrates patent vessels.
Eight patients were included as showing pattern I. They suffered global hypoxic brain injury and their MR images were obtained 14 hours to 6 days (mean: 3.2 days) after the brain insults. The MR angiography obtained in one patient demonstrated patent intracranial arteries (figure 2).
Nine patients were classified as pattern II, and their DWIs showed diffuse high signals in the both the cerebral cortex and the WM. However, the ADC maps demonstrated lower signal intensity in the cerebral WM than that in the cerebral cortical area, and the ADCs resembled the T2-weighted image, the so-called T2-like ADC (figure 3).
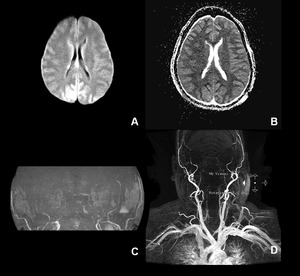
Fig.: Figure 3
DWI (A) shows diffuse high signal intensity in the brain and the ADC map (B) resembles the T2-weighted image in a 55-year-old woman (case 10) who suffered cardiac arrest, and the DWI (A) and ADC map (B) obtained 3 days after brain insult. Time of flight intracranial MR angiography (C) and contrast-enhanced neck angiography (D) demonstrate no intracranial arteries and prominent external carotid arteries, which suggests brain death.
Their etiologies were also global hypoxic brain injury. The time intervals from brain insult to MR imaging ranged from 2 day to 10 days (mean: 5.8 days) for the patients with pattern II. The MR angiography of five patients with pattern II revealed no intracranial vessels, suggesting brain death (figure 3). Case 8 and 9 was one patient with two different patterns of ADC decrease on the serial MR images. It is possible that a pattern 1 ADC decrease could evolve into a pattern 2 ADC decrease over time (figure 4).
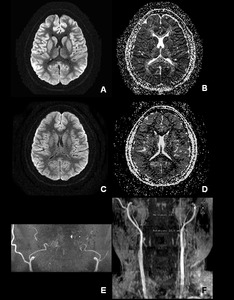
Fig.: Figure 4
A (DWI) and B (ADC map) were obtained 37 hours after cardiac arrest in a 40-year-old man, and they reveal pattern I injury (case 8). However, the follow-up DWI (C) and ADC (D) map obtained 5 days after brain insult show a reversed ADC map (pattern II injury) (case 9). The MR angiography obtained at this time demonstrates nonvisualization of the intracranial arteries (E and F).
In the pattern III group, the DWI showed high signal intensity in the cerebral WM and the ADC maps demonstrated low signal intensity in the cerebral WM, showing a T2-like ADC map. However, the signal intensity of the cerebral cortex on both the DWI and the ADC map appeared normal (figure 5).
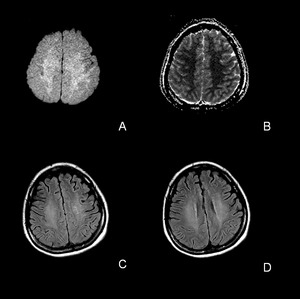
Fig.: Figure 5
A 49 year-old woman (case 18) who suffered from severe hypoglycemia shows pure white matter injury on the DWI (A) and the ADC map (B) obtained 12 hours after the insult. The FLAIR images (C and D) that were obtained eight days after the hypoglycemic event demonstrate leukoencephalopathy.
There were three patients with profound hypoglycemia and their MR images were obtained 6 hours to 12 hours from brain injury. Two patients were seen to have patent intracranial vessels on MR angiography. The patient outcome of this pattern III group was the most favorable of all the patient groups.
Quantitative analysis of the ADC decreases in the patient groups and a control group
The mean ADC values of each anatomical area in the patient groups and a control group were tabulated in table 2. The mean ADC difference of the cerebral cortical area and the cerebral WM in the control group was 40 x 10-6mm2/s.
The absolute difference of the mean ADC values of the cerebral cortex and WM in patient-groups ranged from 231 x 10-6mm2/s to 332 x 10-6mm2/s. Pattern I showed a significantly lower mean ADC value in the cerebral cortical area, but a higher mean ADC value in the cerebral WM than those of the control group. Pattern II demonstrated the lowest mean ADC values in the majority of the measured anatomic areas, except the cerebral cortical area in the pattern I group. In this pattern II group, the cerebral WM and splenium showed more decreased ADC values than that of the cerebral cortical area, the basal ganglia and the thalamus. In the pattern III group, only the cerebral WM and the splenium showed decreased ADC values rather than an increased ADC value in the cerebral cortical areas.
