MR anatomy of Medial Temporal Lobe
•NORMAL ANATOMY
•Because of its different functions and organization,
the temporal lobe may be divided into lateral and medial parts.
•The neural structures that constitute the mesial temporal lobe are the parahippocampal gyrus,
uncus,
hippocampus,
fimbria,
dentate gyrus,
and amygdala.
•The hippocampus is a curved structure on the medial aspect of temporal lobe consisting of complex U-shaped layers of the dentate gyrus and cornu ammonis,
which are interlocked together.
•The cornu ammonis blends into the subiculum,
which forms the transition to the neocortex of parahippocampal gyrus.
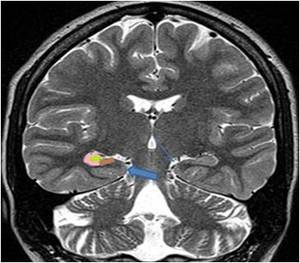
Fig. 1: Coronal TSE T2-weighted scan through the body of the hippocampal formation� Green :Nucleus dentatus� Pink: Ammon’s horn (most of it forms the floor of the lateral ventricle)� Brown: Subiculum, which continues with the gray substance of the parahippocampal gyrus (thick arrow). Thin arrow indicates ambiens cistern.�
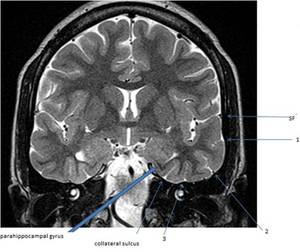
Fig. 2: Coronal turbo spin echo (TSE) T2-weighted depicts the sulci and convolution of the temporal lobe. 1st (first or superior temporal sulcus); 2nd (second or middle temporal sulcus); 3rd (third or inferior temporal sulcus) and SF (Sylvian fissure)
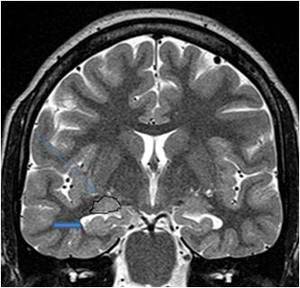
Fig. 3: Coronal TSE T2-weighted MR scan through the head of the hippocampus. The folds (thick arrow) of the pes hippocampi (head of hippocampus), which form the floor or the temporal horn, characterize it. Amygdala (thin arrow) is located above and forms the roof of the temporal horn.
The convex ventricular surface of hippocampus is covered with ependyma,
underneath which tangential white-matter tracts,
called alveus,
pass medially to converge to form the fimbria,
which projects into the ventricular cavity and continues as fornix.
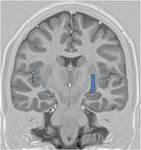
Fig. 4
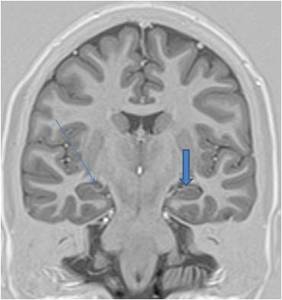
Fig. 4: Coronal IR 1.5-T imaging through the body of the�hippocampus depicts the thin white matter tract (alveus) over convex ventricular surface of hippocampus(thick arrow) and choroidal plexus in the ventricle (thin arrow).
METHODS OF DETECTING HIPPOCAMPAL PATHOLOGY USING MAGNETIC RESONANCE IMAGING
- VISUAL ANALYSIS(QUALITATIVE ANALYSIS)
- QUANTITATIVE MEASUREMENTS OF HIPPOCAMPAL SCLEROSIS.
- 1.
Hippocampal Volumetry
- 2.
T2 Relaxometry
- MR SPECTROSCOPY
Epilepsy Protocol MRI
•Routine MR imaging at our institution includes:
•T1w ,
T2w,
FLAIR,
Diffusion weighted and GRE sequences in axial plane with 5mm slice thickness and 30% interslice gap .
•Inversion recovery (IR) oblique coronal images (TE-51,
TR-3500,
FOV-250 mm,
slice thickness 2 mm) and Oblique coronal T2 W images (TR- 4000, TE- 101,
FOV – 230,
Slice thickness – 2 mm) covering whole brain are acquired.
•Oblique coronal plane is perpendicular to the long axis of hippocampus or the parahippocampal convolution.
•For hippocampal volumetry,
a Oblique coronal three dimensional gradient echo sequence (MP-RAGE: TR-2400,
TE-3.75,
FOV –250,
Flip Angle-8,
Matrix –192x192,
slice thickness 0.85 mm,
interslice gap 1.3mm) is obtained perpendicular to long axis of hippocampus or the parahippocampal convolution (only in selected cases).
•If indicated,
T2 relaxation times of hippocampi (T2 relaxometry) are measured using 16-echo Carr-Purcell-Meiboom-Gill sequence (TE,22-352).
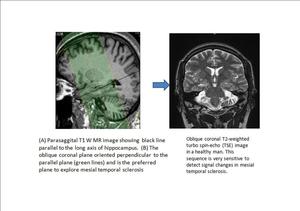
Fig. 5
MAGNETIC RESONANCE FEATURES OF HIPPOCAMPAL SCLEROSIS THAT ALLOW A VISUAL DIAGNOSIS
•CHANGES IN MORPHOLOGY
•HIPPOCAMPAL ATROPHY
•Visual assessment of hippocampal atrophy is the first feature that many radiologists used to assess the hippocampus .
•CHANGES IN TISSUE SIGNAL
•Abnormal Hippocampal T2-Weighted signal.
•Increased T2-weighted signal intensity was the first method that demonstrated a correlation between hippocampal pathology and MR-detectable signal abnormality.
•The atrophic hippocampus often demonstrates decrease signal on T1-weighted images with dark appearance and this correspond to high signal on T2-weighted sequences.
•The IR sequence (heavily T1-weighted sequence) can be thought of as doing the job of increasing sensitivity of T1 images for this feature of signal abnormality.
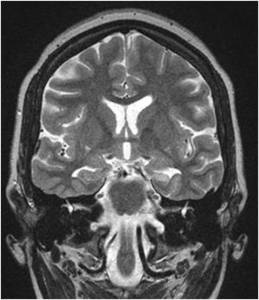
Fig. 6: MR features of HIPPOCAMPAL SCLEROSIS
Primary signs
1. A small atrophic unilateral hippocampus.
2. Hyperintensity on T2 W images.
3. Loss of the hippocampal internal architecture and that of normal digitations of the head.
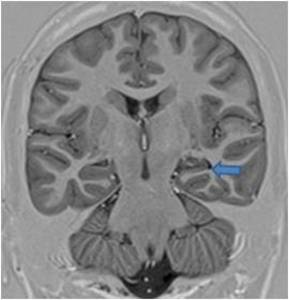
Fig. 7: IR Image showing atrophy with hypointensity of the left Hippocampus (arrow).
Secondary signs of Hippocampal Sclerosis Fig. 8
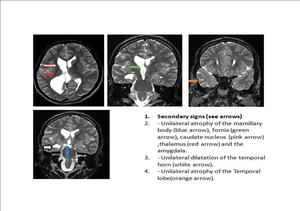
Fig. 8
QUANTIATIVE MEASUREMENTS OF HIPPOCAMPAL SCLEROSIS
•Hippocampal Volumetry
•Ipsilateral hippocampal volume loss is sensitive and specific indicator of hippocampal sclerosis in the clinical context of epilepsy.
Because of relatively anisotropy of the hippocampus,
slices 3-mm thick or less are necessary for accurate estimation of hippocampal volume.
•T2 Relaxometry
•Hippocampal T2 relaxation time increases in patient of hippocampal sclerosis.
•T2 relaxation times are easy to acquire,
and post acquisition processing to calculate T2 maps from these data takes only a few minutes.
The necessary acquisition and processing software is available on most commercial imaging systems,
and the measurement of T2 in the region of interest is then made.
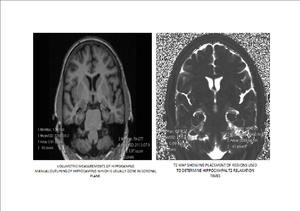
Fig. 9: QUANTITATIVE MEASUREMENTS OF HIPPOCAMPAL SCLEROSIS.
1. Hippocampal Volumetry
2. T2 Relaxometry: This quantative measurement is an objective means of determining the frequency and severity of T2 abnormality. Hippocampal T2 relaxation time increases in patient of hippocampal sclerosis.
MR Spectroscopy
1.N-acetylaspartate occurs in neurons but not in mature glial cells.
Thus,
it is considered a marker of neuronal abundance or function.
In comparison,
creatine activity and choline activity are associated more with glial cells than with neurons.
2.N-acetylaspartate and creatine signals can be measured with 1H MRS to assess 2 major pathological features of MTS: decreased NAA for neuronal loss and slightly increased or unchanged creatine for astroglial proliferation.
3.The ratio between NAA and creatine signals is frequently used to detect temporal lobe abnormalities in candidates for epilepsy surgery.
4. The correspondence between the decreased NAA: creatine ratio and the side of MTS or EEG-detected seizure onset (EEG seizure onset) is as high as 90% in temporal lobe epilepsy.
5.
Also,
1H MRS is especially helpful in patients who do not have Hippocampal atrophy.
6.
Thus,
1H MRS is sensitive enough to detect mild cases of MTS,
ie,
MTS not severe enough to be identified as hippocampal atrophy on MRI.
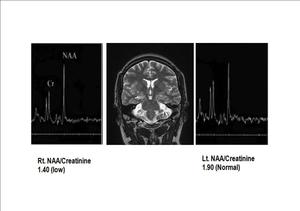
Fig. 10: Magnetic resonance spectroscopy 1H spectra measured in the temporal lobes of an 16-year-old patient with intractable epilepsy. The NAA/Cr ratio in the right(RT) temporal region is considerably lower than control values, whereas the ratio is normal on the left(LT) side. Since undergoing a right temporal lobectomy, the patient has been seizure free.
Functional Neuroimaging in Epilepsy
•Presurgical planning in epilepsy involves identifying eloquent cortex close to the lesion,
which if injured during surgery will manifest with neurologic deficit.
•The goal of presurgical functional imaging is to minimize damage to these functional areas by knowing the location of eloquent cortex.
PET and SPECT
•Approximately 30% of the patients with temporal lobe epilepsy have a normal MRI scan. In this subgroup of patients,
PET studies have shown temporal lobe hypometabolism ipsilateral to ictal onset zone in 87% of the patients.
•Ictal SPECT has been shown to have a higher success in lateralizing seizure onset in patients with well-established temporal lobe epilepsy.
•Thus,
PET or ictal SPECT may be a complementary tool in the presurgical evaluation of patients with medically intractable epilepsy,
particularly with negative MRI.
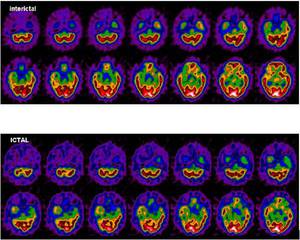
Fig. 11: Images of SPECT scan in a patient presenting with epilepsy showing hypoperfusion in right temporal region in both interictal and ictal phases.
Blood oxygenation level-dependent (BOLD) functional MRI (fMRI)
•Clinical fMRI is based on blood oxygenation level-dependent (BOLD) contrast.
•BOLD signal response arises from localized hemodynamic changes induced by regionally increased neuronal activity associated with processing a stimulus or performing a cognitive task defined by the paradigm.
•BOLD fMRI is a high spatial resolution technique without ionizing radiation that maps physiologic and metabolic consequences of altered electrical activity in the brain.
•fMRI has the potential to predict the possible deficits in language,
and in visual,
motor,
and sensory functions that would arise from the surgical intervention.
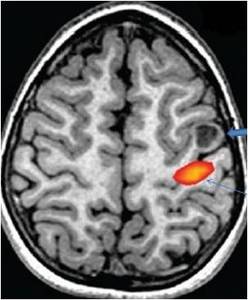
Fig. 12: A 16-year-old with cortical dysplasia (thick arrow) involving precentral gyrus on the left side. Real-time fMRI obtained after right finger tapping vs rest shows activation of primary hand motor area (thin arrow) placed close to the lesion. If resection extends to primary hand motor area, the patient is likely to develop post procedure neurologic deficit.