ECR 2013 / B-0807
Use of multimedia structured reporting for tumour response assessment.
Congress:
ECR 2013
Poster Number:
B-0807
Type:
Scientific Paper
Keywords:
Computer applications, Oncology, CT, PACS, RIS, Computer Applications-General, Health policy and practice, Structured reporting, Metastases, Neoplasia
Authors:
D. J. Vining1, A. Pitici2, I. Aghenitei2, C. Popovici2, M. Jurca2, R. Rosu2, A. Tsimberidou1; 1Houston, TX/US, 2Chapel Hill, NC/US
DOI:
10.1594/ecr2013/B-0807

Fig. 1:
Comparing conventional narrative reports for tumor response assessment is...
")
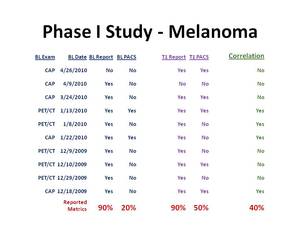
Fig. 2:
Analysis of the conventional narrative radiology reports from ten patients...

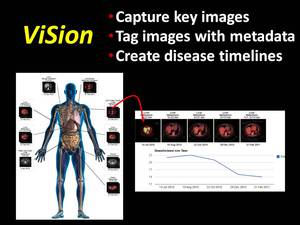
Fig. 3:
The ViSion structured reporting system captures key images, tags those images...

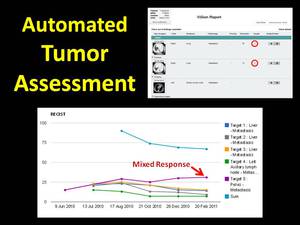
Fig. 4:
Specific image findings can be designated as "target lesions" that are used to...