1.
ARILI diagnosis overview:
According to the the RTOG criteria for ARILI diagnosis,
ARILI was observed in 18 patients out of 51 within 12 weeks after administration of radiotherapy.
Among the 18 patients with ARILI,
11 cases (11/18) occurred in the middle of the radiotherapy course (in week 4,
about 30 Gy dose),
7 cases (7/18) occurred at the end of radiotherapy course (in week 8) and one month later (in week 12).
Typical HRCT manifestations of ARILI (all in the irradiated lung area) were observed on follow-up 12 months after radiotherapy,
only 7 out of the 18 patients presented positive HRCT results prior to 12 weeks post therapy ( one diagnosed in week 4,
six diagnosed in weeks 8 and 12).
Patients with ARILI manifestations were placed in ARILI group (18 patients) and the rest in non-ARILI group.
2.
Variances of the CTPI parameters in non-irradiated lung areas:
There was no statistically significant differences in CTPI parameters in non irradiated area measured prior to commencement of the radiotherapy and after completion of the therapy (Table 1).
Additionally,
there was no statistical significant differences in CTPI parameters in the non-irradiated area between ARILI group and non-ARILI group.
3.
Variance in normalized CTPI values in irradiated areas:
In non-ARILI group rrBF,
rrBV,
rrPS rose gradually from week 4,
week 8 after radiotherapy,
and dropped slowly after the therapy was completed (week 12),
representing a trend of “slow-rise to slow-fall” (Figure 1).
Statistical significance was found in comparing the rrBF and rrBV acquired pre- and post-radiotherapy (t = 4.56 and 5.21,
P = 0.000 and 0.000 respectively) by week 4,
but not in rrPS (t = 1.63,
P = 0.117).
No statistical significance has been found for rrBF,
rrBV and rrPS in week 4,
8 and 12 with P>0.05 (in One-way ANOVA,
F-test).
In the ARILI group,
rrBF,
rrBV and rrPS rose in the irradiated lung area by week 4,
showing statistically significant difference in comparison to those acquired before therapy,
respectively (t = 3.29,
5.04,
7.53,
P = 0.003,
0.000 and 0.000).
The rrBF,
rrBV and rrPS continued to rise with the increase in radiation time and dose during therapy.
All perfusion parameters maintained rapid continued rise until 1 month after completion of radiotherapy (week 12),
presenting as either “rapid-rise to slow-rise” trend or “rapid-rise to flat” trend.
The variances at each evaluation in CT perfusion parameters are shown in Table 2 and Figure 1.
An increasingly significant difference in CTPI parameters acquired after commencement of radiotherapy was observed between the ARILI group and non-ARILI group.
Especially in rrPS,
statistically significant difference was demonstrated (P<0.05) in week 4,
week 8 and week 12.
Similarly statistically significant difference was demonstrated in rrBF,
rrBV and rrPS in week 12 ( P<0.05,using Dunnett t-test,
see Table 2 and Figure 1).
4.
Comparison of diagnostic efficacy for ARILI between CTPI and HRCT
Only one out of the 11 ARILI demonstrated positive HRCT manifestation in week 4 (half overall irradiation dose),
which appeared as a small patchy exudate in the irradiated lung field.
However,
in all these 11 ARILI patients significant abnormal perfusion was observed on CTPI in week 4 (Figure 2),
with 6 of them diagnosed with level 3 to 4 ARILI in week 8 or week 12,
and demonstrative findings of ARILI on HRCT (Figure 3 - 5).
Setting rrPS = 1.28 as a threshold in week 4 (higher than 1.28 was considered ARILI positive) sensitivity,
specificity,
positive predictive value and negative predictive value of CTPI for ARILI diagnosis were 90.9%,
90.0%,
71.4% and 97.3% respectively,
which were significantly higher than those of HRCT (9.1%,
92.5%,
25.0% and 78.7% respectively).
However,
these differences in test specificity and sensitivity decreased in week 8 and week 12 while still showing statistical significance.
Comparison of ARILI diagnosis by CTPI and HRCT at different time points was shown in Table 3.
Table 1 Variances of CTPI parameters in non-irradiated lung area at different time points pre- and post-radiotherapy
| |
rBF
|
rBV
|
rPS
|
|
rrBF
|
rrBV
|
rrPS
|
|
0w(n=51)
|
141.8±27.5
|
13.49±2.77
|
9.36±2.88
|
|
1.00±0.09
|
1.00±0.10
|
1.00±0.12
|
|
4w(n=51)
|
143.5±28.3
|
13.54±2.65
|
9.41±2.53
|
|
1.02±0.16
|
1.00±0.14
|
1.03±0.09
|
|
8w(n=25)
|
142.7±37.9
|
12.63±2.99
|
9.02±2.96
|
|
1.01±0.13
|
1.05±0.13
|
0.99±0.11
|
|
12w(n=26)
|
143.3±28.4
|
13.80±3.12
|
9.57±2.66
|
|
1.04±0.12
|
1.02±0.14
|
1.01±0.13
|
|
F / P value
|
0.67/0.57
|
0.10/0.96
|
0.35/0.78
|
|
0.87/0.45
|
0.96/0.41
|
0.39/0.75
|
Table 2 CTPI parameters in the ARILI group and non-ARILI group in irradiated lung area at different time points pre- and post-radiotherapy
| |
Non-ARILI group
|
|
ARILI group
|
| |
rrBF*
|
rrBV*
|
rrPS
|
|
rrBF*
|
rrBV*
|
rrPS*
|
|
0w
|
1.03±0.09
|
1.02±0.08
|
0.99±0.11
|
|
1.05±0.11
|
0.98±0.12
|
1.03±0.10
|
|
4w
|
1.23±0.21
|
1.20±0.13
|
1.05±0.17
|
|
1.32±0.33
|
1.28±0.21
|
1.38±0.17#
|
|
8w
|
1.27±0.32
|
1.24±0.24
|
1.08±0.19
|
|
1.41±0.21
|
1.39±0.23
|
1.44±0.14#
|
|
12w
|
1.19±0.12
|
1.21±0.26
|
1.06±0.26
|
|
1.44±0.22#
|
1.42±0.14#
|
1.47±0.21#
|
|
F/P value
|
12.49/0.000
|
14.34/0.000
|
2.33/0.074
|
|
22.40/0.000
|
19.67/0.000
|
23.43/0.000
|
|
MSD
|
0.104
|
0.096
|
0.089
|
|
0.142
|
0.116
|
0.143
|
MSD:Minimum Significant Difference,
Dunnett test.
*There were significant differences for CT perfusion parameters in irradiated lung field between pre-radiotherapy(0w) and post-radiotherapy(4w,
8w,
12w),
P<0.05.
#There were significant differences for CT perfusion parameters between ARILI AND non-ARILI in irradiated lung field at the same time point (P<0.05).
Table 3 Comparison of positive cases of ARILI diagnosed by CTPI and HRCT at different time points
| |
0 w
|
4 w
|
8 w
|
12 w
|
|
CTPI (n)
|
0
|
10
|
9
|
9
|
|
HRCT (n)
|
0
|
1
|
3
|
4
|
|
P
|
/
|
0.0003*
|
0.0090*
|
0.0294*
|
* : by the Fisher exact test with bilateral cumulative probability.
The results indicated each P < 0.05,
suggesting the significant differences for diagnosing ARILI between CTPI and HRCT.
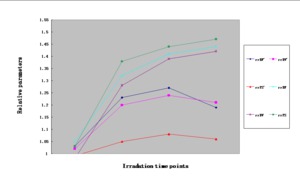
Fig. 1: Fig 1. Trend chart of changes in relative parameters at pre- and post-irradiation time points in non-ARILI and ARILI groups. The upper three lines represent the changing trend of rrPS, rrBF, rrBV, respectively, in ARILI group. And the lower ones represent those in non-ARILI. The differences between trend lines progressively increased after radiation, particularly in rrPS, between the two groups. The differences of rrPS between the two groups were always statistically significant at every time point (t=6.625, 4.959, 4.048, respectively; each P< 0.05).

.")
. The patient suffered from chest pain and cough, and was diagnosed ARILI (RTOG, Level 1) in clinic. Fig 2a. Plain CT image (lung window) showed an intrathoracic stomach with no significant abnormalities found in bilateral lung fields. Fig 2b-2d (BF, BV, PS map, respectively) demonstrated yellow-green or orange-yellow regions corresponding to hemodynamic changes found in irradiated fields (near mediastinal region), which indicated regional increased perfusion. The mean rrBF, rrBV and rrPS were 1.39, 1.28 and 1.31, respectively.")
 and 3b (PS map) show no abnormal perfusion in both lung field before irradiation (0 Gy).")
 time point after radiation, the clinical comprehensive diagnosis was ARILI (RTOG , level 2) . The BF and PS maps (Fig 4a and 4b) showed inhomogeneous areas of high perfusion (red-yellow or yellow-green colour) in the irradiated field (rrBF=1.40, rrPS=1.37), especially in the area near the mediastinum. However,at the same time point, HRCT (Fig 4c) showed clear lung fields with no abnormal findings.")
 , the clinical comprehensive diagnos was ARILI (RTOG , level 3) . The BF and PS maps (Fig 5a and 5b) showed increasing inhomogeneous elevated perfusion (red-yellow colour) in the irradiated field, more obvious than those at 4 w (rrBF=1.66, rrPS=1.59). HRCT (Fig 5c), at the same time point, showed that there were patchy opacities in bilateral lung fields, particularly in the right lung field. These findings denoted the patchy exudation type of ARILI.")