1.
Subject characteristics.
Group of decreased Metavir score was 20 patients (14 men,
6 women ; mean age,
51.3 years ; range,
27 to 70 years).
Of the 20 patients,
7 patients had liver cirrhosis and 13 patients had non-liver cirrhosis.
Group of no changed or increased Metavir score was 44 patients (29 men,
15 women ; mean age,
54.1 years ; range,
21 to 76 years).
Of the 44 patients,
27 patients had liver cirrhosis and 17 patients had non-liver cirrhosis.
Table 1.
Clinical characteristics of the study subjects( n=64)
|
|
Score decreasing group (n=20)
|
Not-decreasing group (n=44)
|
p-value
|
|
Men/woman
|
14/6
|
29/15
|
0.751
|
|
Age(mean)
|
51.3
|
54.1
|
0.880
|
|
Viral(HBV+HCV)/ non-viral
|
13/7
|
36/8
|
0.145
|
|
Cirrhosis/non-cirrhosis
|
13/7
|
17/27
|
0.051
|
ARFI technology correlated shear-wave velocity between fibrosis and normal tissue in chronic liver disease.
Until now,
previous study were analyzed patients with acute liver damage which means initial liver stiffness suggestive of liver cirrhosis,
but none of patients showed any sign of liver cirrhosis by ultrasound examinations. In this present study,
13 patients of the Metavir score decreasing group have cirrhosis in physical examination and ultrasonography.
So,
even though in case of cirrhosis,
could be combined with aucte hepatitis and improved fibrosis score at follow up.
Case 1) ARFI image and CT in 36 years old man who haver hepatitis B

Fig. 5: The change of value in SWV and biochemical marker
References: Deparment of Radiology, Dong-A university hospital, Pusan, Korea, 2013
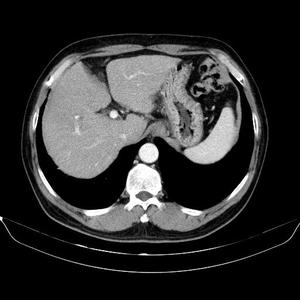
Fig. 6: In CT, liver shows nodular aspect in liver surface with quadrate lobe enlargement, suggestive liver cirrhosis.
References: Deparment of Radiology, Dong-A university hospital, Pusan, Korea, 2013
2) ARFT image and CT in 64 years old man who have hepatitis C
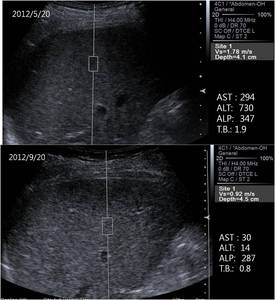
Fig. 7: The change of value in SWV and biochemical marker
References: Department of Radiology, Dong-A university hospital, Pusan, Korea, 2013

Fig. 8: The liver shows not any sign of cirrhosis.
References: Deparment of Radiology, Dong-A university hospital, Pusan, Korea, 2013
2.
Change of biochemical activity.
In comparison of lab data between two groups,
decreased fibrosis score was significantly associated with decreased follow up aspartate aminotransferase (AST) level (-42.75 18.70 mg/dl,
versus -4.45 5.02 mg/dl,
P =0.000) and alanine aminotransferase (ALT) level (-95.25 44.86 mg/dl,
versus -7.22 2.57,
P = 0.000).
Comparison of the differnce of ALP or total bilirubin between admission day and follow up showed no significant correlation,
with the p-value (p=0.26,
0.163).
Table 2.
Baseline charcterics of decreasing group in Metavir score (n=20) on admission day
|
|
sex
|
Age
|
etiology
|
AST
|
ALT
|
ALP
|
Bilrubin
|
SWV
|
|
1
|
M
|
65
|
Toxic
|
35
|
34
|
32
|
1.2
|
F2
|
|
2
|
F
|
54
|
HBV
|
44
|
38
|
392
|
0.4
|
F4
|
|
3
|
F
|
42
|
Autoimmune
|
70
|
61
|
240
|
1.0
|
F1
|
|
4
|
M
|
62
|
HBV
|
326
|
667
|
360
|
1.3
|
F2
|
|
5
|
M
|
57
|
HBV
|
46
|
84
|
271
|
1.0
|
F2
|
|
6
|
M
|
60
|
Alchol
|
33
|
9
|
285
|
1.2
|
F4
|
|
7
|
M
|
48
|
HBV
|
34
|
41
|
270
|
0.7
|
F2
|
|
8
|
M
|
64
|
HCV
|
294
|
730
|
347
|
1.9
|
F3
|
|
9
|
M
|
36
|
HBV
|
173
|
180
|
299
|
0.7
|
F4
|
|
10
|
M
|
70
|
Alchol
|
26
|
14
|
154
|
0.5
|
F3
|
|
11
|
M
|
50
|
HBV
|
59
|
114
|
209
|
0.8
|
F2
|
|
12
|
F
|
56
|
HBV
|
22
|
22
|
260
|
1.2
|
F2
|
|
13
|
F
|
54
|
HCV
|
30
|
42
|
298
|
0.8
|
F4
|
|
14
|
M
|
56
|
Alchol
|
27
|
17
|
217
|
0.9
|
F3
|
|
15
|
M
|
39
|
HBV
|
50
|
58
|
267
|
1.5
|
F4
|
|
16
|
M
|
37
|
HBV
|
24
|
38
|
201
|
0.8
|
F1
|
|
17
|
M
|
27
|
HBV
|
26
|
12
|
163
|
1.2
|
F2
|
|
18
|
M
|
59
|
Alchol
|
20
|
20
|
161
|
0.5
|
F1
|
|
19
|
F
|
38
|
Alchol
|
124
|
85
|
757
|
4.6
|
F1
|
|
20
|
F
|
52
|
HBV
|
23
|
16
|
203
|
1.6
|
F1
|
Table 3.
Comparison of lab data between decreasing group and not-decreasing group at Metavir score
|
Group
|
|
AST (mean)
|
ALT(mean)
|
ALP (mean)
|
Bilirubin(mean)
|
|
Decreased
|
Admission
|
74.3
|
114.1
|
269.3
|
1.19
|
|
Follow
|
31.5
|
18.85
|
233.65
|
0.83
|
|
Not-decreased
|
Admission
|
36.95
|
28.06
|
281.44
|
1.07
|
|
Follow
|
32.5
|
20.84
|
277
|
1.03
|
|
p-value
|
Difference of lab data
|
0.0001
|
0.00001
|
0.126
|
0.163
|
3.
Reproducibility of ARFI
We evaluated the shear wave velocity (SWV) of 6 normal subjects the control group who underwent 5 trials per day,
during 5 days to evaluate the reproducibility of ARFI elastography measurement.
The coefficient variation value calculated as dividing the standard deviation by the mean and multiplying by 100 was 9.07±3.19 (range,
7.6 to 11.4).
There was no statistical difference between the mean of SWV at the each trial.
Metavir score results need to be interrupted with caution in patients with acute liver damage(High level of ALT),
and high value of liver stiffness do not predict the simultaneous presence of cirrhosis in these patients


