Magnetic Resonance Imaging (MRI) technique
In TWMU,
more than 1,200 MR examinations in urological systems per year are performed.
Our hospital has six MR scanners; of these,
three MR scanners with 1.5 or 3 tesla-superconducting system are used to obtain Time-SLIP MRA images (Toshiba Medical Systems,
Otawara,
Japan) as follows: Vantage TitanTM 3T (Open Bore,
3 tesla),
Vantage TitanTM 1.5T (Open Bore,
1.5 tesla) and EXCELART VantageTM powered by Atlas (1.5 tesla).
Concepts of NC-MRA with Time-SLIP method
Time-SLIP is the highest MR signal control technology in the NC-MRA.
It can isolate any branch vessel and visualize the flow direction or hemodynamics [1-9].
The MR signals obtained with Time-SLIP method consist of inversion pulses,
inflow effect and background signals.
The Time-SLIP method is simultaneously used with TrueSSFP or FSE sequences.
The scanning conditions have to be optimized by region of interest.
Factors determining the imaging quality are the relationship between inversion pulses and the regions of interest,
inflow of artery and vein,
combination of inversion pulses for background signal suppression and status of respiratory gate.
The advantages of NC-MRA with Time-SLIP are: 1) no risk for allergy or NSF; 2) images can be scanned again and again,
3) Both artery and vein can be isolated; 4) Excellent background signal suppression; and 5) even a narrow collateral pathway can be detected.
In contrast,
the disadvantages of NC-MRA with Time-SLIP are: 1) artifacts due to flow speed/direction and patient's movement; 2) the image quality depends on operator's technique and experience; and 3) relatively long examination time.
Scanning methods of NC-MRA with Time-SLIP method
All patients were imaged by using TrueSSFP and TrueSSFP associated with Time-SLIP pulse sequences (Fig. 1) and body spine coils on superconducting systems operating at 3T and 1.5T (Table 1).
For renal artery visualization,
scanning plane with coronal section was mainly used.
For transplant renal artery visualization,
scanning planes with axial and coronal section was optionally used.
To obtain the detail flow dynamics of the renal artery abnormality,
additional images with several BBTI values were scanned after obtaining the routine MRA images.
As compared with a 1.5T scanner,
the merits using a 3T scanner in renovascular MRA and 4D imaging comes down to the points of high-resolution and high contrast,
i.e., a 3T scanner can make blood vessels from proximal side to peripheral side clearer rather than a 1.5T scanner.
Fig.1 Schematic diagram of NC-MRA with Time-SLIP method.
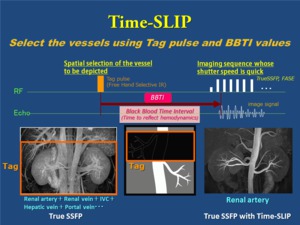
Fig. 1: Schematic diagram of NC-MRA with Time-SLIP method.
Table 1.
Scanning Parameters in NC-MRA with Time-SLIP.
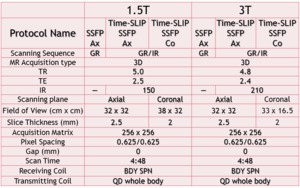
Table 1: Scanning Parameters in NC-MRA with Time-SLIP.
How to reconstruct 4D images?
1.
Scanning method
- Routine MR imaging methods were shown in Table 1.
- Scanning field was set which includes the target objects.
- A tag pulse was set as it includes the area where the targeted vessel runs into the region of interest.
- In abdomino-pelvic region,
coronal image are usually obtained.
- For signal acquisition,
respiratory or ECG-gating is used.
- As MR scanning sequences for visceral artery visualization,
we ordinarily use 3D TrueSSFP sequence associated with Time-SLIP method.
- MRA images are obtained with several values of black blood time interval (BBTI) which controls time axes.
2.
Image transmission
- All the scanned images are transmitted to the following online workstations: 1) AZE VirtualPlace Fujin Raijin,
3.2012 (r12117),
AZE,
Ltd.,
Tokyo; 2) Aquarius Net Station,
V4.4.6.80; TeraRecon,
Inc.,
San Mateo,
Calif.
3.
Image processing on workstations
- 4D images can be created directly from the original images scanned at several phases of time-axes using software plug-in (4D analysis 3.0) equipped with AZE workstation.
- 3D reconstruction images (thick or thin-slab maximum intensity projection (MIP), volume rendering (VR) or multiplanar reformation (MPR) images) are created from the original images scanned at several phases of single or several time axes using softwares (3D analysis) equipped with Aquarius Net Station.
4.
Image display methods
- From the following methods of image display (Table 2),
a method suitable for the purpose is chosen.
Image display in 4D fashion is possible by arranging the scanned images along the time axes (Fig. 15 ) or the order of slice levels (Fig. 12 Fig. 13 Fig. 14).
Table 2.
Variety of presentation of 4D NC-MRA images
|
Image reconstruction methods
|
Parameters #1
|
Parameters #2
|
| MPR |
Time-axes* |
Multi-planar** |
| MIP (thin-slab) |
Time-axes* |
Single- or Multi-planar** |
| MPR (thick-slab) |
Time-axes* |
Single-planar |
| VR |
Time-axes* |
Single-planar |
* Time-axes were controlled by using BBTI values.
** Multi-planar images were arranged with the discretionary slices or whole slices.
Fig.
15.
Image display in 4D fashion,
by arranging the scanned images along the time axes
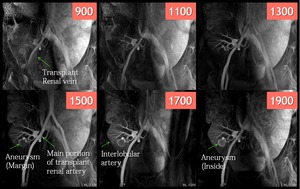
Fig. 15: Case 4. 38-year-old man with AVF in transplant kidney.
D, 4D coronal MIP images scanned with TrueSSFP associated with Time-SLIP. Sequential changes in BBTI values ranging from 900 to 1900 makes changes in findings of various objects. The numbers within the figures indicate a value of BBTI.
Why we use 4D images?
4D Time-SLIP images may be useful in following conditions.
1.
Detection of flow direction within the small arterio-venous fistula (AVF).
- Tiny feeding arteries related to AVF and drainage veins via the nidus can be isolated by using the serial 4D images (Case 1: Fig. 2 Fig. 3 Fig. 4 Fig. 5 Fig. 6 Fig. 5).
- Also,
minute or complex vascular lesions of the transplant kidney (i.e.,
small AVF in the transplant kidney,
intricate channels such as vascular diseases in the renal hilum) can be detected by serial changes in 3D-VR/MIP images with 4D fashion.
Fig.
4: A minute AVF in transplant kidney.
Tiny feeding arteries related to AVF and drainage veins via the nidus can be isolated by using the serial 4D image (Please also see Fig. 4).
2.
Detection of small or unclear vascular lesions of the visceral artery.
(e.g.,
tiny renal artery aneurysm,
unclear pancreatic AVM)
- Color display of the 4D NC-MRA images may enhance the subtle blood flow.
For example,
in a small narrow-neck aneurysm,
4D images may provide detailed information such as accurate branching site and neck of the aneurysm,
extent of the blood flow flowing into the aneurysm through the neck and intra-aneurysmal blood flow (e.g.,
presence of turbulent flow) (Case 2: Fig. 7 Fig. 8).
- Vascular lesions with high-flow state may be detected by using colored display of 4D dynamic imaging if the lesions are missed by dynamic study using gadolinium (Case 3: Fig. 9 Fig. 10 Fig. 11).
Fig.
8: 4D images may provide detailed information of a small saccular renal artery aneurysm.
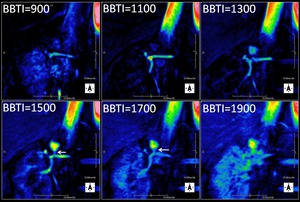
Fig. 8: Case 2. 54-year-old woman with a small, saccular renal artery aneurysm with narrow-neck.
B, Coronal thin-slab MIP images scanned with Time-SLIP method were displayed by using with color pattern “rainbow”, and arranged in order of the time axes (4D Time-SLIP images).
3.
Detection of the optimal values of BBTI for shortening the examination time.
- There is an individual difference in the BBTI values where a blood vessel is best depicted.
BBTI values can be influenced by various factors such as age,
locations and types of renal diseases,
types and blood flow rates of vessels (artery,
vein or portal vein),
heart rates and background structures.
- 4D-Time SLIP can be applied to detect the optimal BBTI value that properly visualize the region of interest: we call this operation “BBTI search” (Case 4: Fig. 12 Fig. 13 Fig. 14 Fig. 15); the images used in BBTI search can also be used for routine image interpretation and creation of variety of 3D reconstructed images (MIP,
VR and MPR images) thanks to usage of 3D protocols.
- Many times of actual MRA scans were used to be necessary to know the optimal BBTI values.
Herein,
we developed a new method "BBTI search" by which we can easily detect an optimal BBTI value for the scanning object with the 4D Time-SLIP-assisted BBTI search (Case 4: Fig. 12 Fig. 13 Fig. 14 Fig. 15 Fig. 16).
- The BBTI search dramatically decreased total scan time (Fig. 16) because of diminished time consumption due to the repeated actual scan (Table 3).
Fig.
12: Optimal BBTI value that the aneurysm is depicted best.

Fig. 12: Case 4. 38-year-old man with AVF in transplant kidney. 4D oblique coronal section MPR images scanned with TrueSSFP associated with Time-SLIP (BBTI values, 900, 1100, 1300, 1500, 1700 and 1900). Optimal values of BBTI can be determined according to the regions of interest (4D time-SLIP-assisted BBTI search).
A, Slice #14. We searched an optimal BBTI in the slice that aneurysm is depicted best.
Fig.
13: Optimal BBTI value that the transplant renal vein is depicted best.
Fig. 13: Case 4. 38-year-old man with AVF in transplant kidney. 4D oblique coronal section MPR images scanned with TrueSSFP associated with Time-SLIP (BBTI values, 900, 1100, 1300, 1500, 1700 and 1900). Optimal values of BBTI can be determined according to the regions of interest (4D time-SLIP-assisted BBTI search).
B, Slice #25. We searched an optimal BBTI in the slice that the transplant renal vein is depicted best.
Fig.
14: Optimal BBTI value that the transplant renal artery is depicted best.

Fig. 14: Case 4. 38-year-old man with AVF in transplant kidney. 4D oblique coronal section MPR images scanned with TrueSSFP associated with Time-SLIP (BBTI values, 900, 1100, 1300, 1500, 1700 and 1900). Optimal values of BBTI can be determined according to the regions of interest (4D time-SLIP-assisted BBTI search).
C, Slice #28. We searched an optimal BBTI in the slice that the transplant renal artery is depicted best.
Fig.
16.
Time-SLIP flow charts
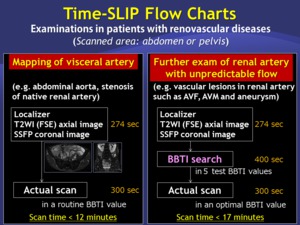
Fig. 16: Time-SLIP flow charts.
Table 3.
MRA sequences for BBTI search
|
Types of BBTI search
|
Signal acquisition sequence
|
Scanning time*
|
Image quality
|
3D reconstruction
|
| 2D |
TrueSSFP with
Time-SLIP
|
Short
(75 seconds)
|
Relatively poor |
Impossible |
| 3D |
TrueSSFP with
Time-SLIP |
Relatively long (400 seconds)
|
Good |
Possible |
*Time required for scanning in five BBTI values
- In addition,
we can obtain better MRA images by rescanning the NC-MRA with the BBTI value detected in BBTI search with increase in numbers of segments.
4.
Visualization of hypervascular urological tumors.
(e.g.,
ill-defined large RCC occupying the kidney)
- NC-MRA assisted with 4D images may enhance the feeding arteries and associated tumor vasculature within the tumor mass,
causing clearer visualization of the main mass and tumor thrombus (Case 5: Fig. 17 Fig. 18 Fig. 19 Fig. 20).
FIg.20: 4D Time-SLIP clearly depicts the extent of a hypervascular tumor.
Fig. 20: Case 5. 64-year-old man with RCC associated with renal vein tumor thrombus. D, Coronal thick-slab MIP images scanned with Time-SLIP method were displayed using with color pattern “rainbow” (4D Time-SLIP images). The renal tumor is depicted as a hypervascular tumor (arrows) as compared with the left kidney. 4D images show that a renal artery flows into tumor.
Advantages and weakness of 3D or 4D reconstruction images
- Thick-slab MIP: The advantage of thick-slab MIP image is suited to represent the outward appearance of the lesion.
The weakness of MIP is illegible visualization of small-caliber vessels and unclear relationship with surrounding structures (Case 5A: Fig. 17).
- Thin-slab MIP or MPR: In contrast,
the advantage of thin-slab MIP or MPR image is that it can make clear the relationship between the target lesion and the surrounding structures (Case 5B: Fig. 18).
- 4D images: These characteristics of 3D reconstruction images can also be applied in 4D images; therefore,
it is necessary to choose a reconstruction method depending on the targeted objects.
Colored display can effectively demonstrate the subtle changes in regional blood flow (Case 5C-D: Fig. 19 Fig. 20).


.")


.")


 fed by double feeders (B and C: pink arrows) near the pseudoaneurysm, which reconstituted into the main transplant renal vein.")
