Subjects
Three subjects were excluded from the analysis due to motion artifacts on DWI images (two subjects) or due to incomplete acquisition of the MR protocol (one subject).
The final number of women evaluated for this study was thirty seven (mean age,
70.6±6.8 years; age range,
55-80 years) (Table 2).
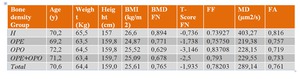
Table 2: Demographic, DXA and MR data in normal (H), osteopenic (OPE) and osteoporotic (OPO) group. (main values).
No correlation was found between subjects’ T-scores and age,
and no age,
weight,
height and BMI differences were statistically significant among groups (Table 2).
No correlation between the body mass index (BMI) and the DXA [14] or the MR parameters was observed.
FF
Mean FF values (Table 2) were significantly different (P=0.029) between healthy and osteoporotic subjects only (Fig.
2).
Significant correlations between FF and T-score (R=-0.58) and between FF and age (R=0.52) were observed when all groups together are considered.
After adjusting for age,
a significant correlation was only found between reduced BMD cohort grouped together and T-score (R=-0.3).
DTI parameters
Reproducibility of DTI measures was satisfactory.
CV was approximately 2% - 3% for MD and 4% - 5% for FA measurements (Table 3).
Moreover,
no significant difference was found in both MD and FA measurements between the two separate sessions comprised of six healthy volunteers(Table 3).
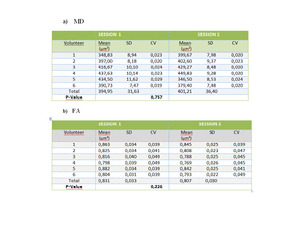
Table 3: The short and long-time reability study for six healthy subjects. A) MD evaluation; b) FA evaluation
MD values were different (P<0.001) between healthy and osteoporotic and between (P<0.001) healthy and osteopenic subjects.
On the other hand,
osteopenic and osteoporotic patients cannot be discriminated on the basis of their MD values.
-A significant correlation between MD and FF was observed (R=0.75) in the healthy group ;
-A moderate correlation was found between MD and T-score (R=0.41,
P=0.01) when all groups together are considered;
-No significant correlation was found between MD and T-score within groups (Fig.
3b).
FA values were different (P<0.001)between healthy and osteoporotic and between (P=0.025) healthy and osteopenic subjects;
-Conversely,
osteopenic and osteoporotic subjects cannot be discriminated on the basis of their FA Values;
- A significant positive correlation between FA and FF was found in both osteopenic (R=0.63) and osteoporotic (R=0.70) group ;
-Vice-versano correlation between FA and FF was observed in the healthy group or when all subjects are considered;
-A high significant positive correlation was found between FA and T-score in all groups together (R=0.66,
P<0.0001) in the healthy (R=0.7) and in the osteoporotic (R=0.61) groups ;
-FA/FF versus T-score in the femoral neck showed a positive significant correlation in healthy and
osteopenic groups (R=0.79,
and R=0.62,
respectively) ;
- FA vs T-score,
FA/FF vs T-score values were significantly different (P=0.012) between osteopenic and osteoporotic patients and between healthy and osteoporotic subjects (P<0.0001);
- FA vs T-score,
FA/FF vs T-score didn’t discriminate between healthy and osteopenic subjects.
-A correlation was found between FA/FF and T-score (R=0.76,
P<0.0001),
higher than that between FA and T-score,
when all groups together were considered;
-MD/FF showed a behavior similar to MD,
but a higher correlation between MD/FF and T-score (R=0.50,
P<0.001) was found when compared to that between MD and T-score ;
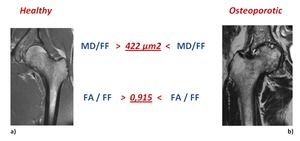
Fig. 3: MRI Images of an healthy (a) and of an osteoporotic (b) femoral neck . The MD/FF value of 422 µm2 represents the cut off to discriminate an healthy from an osteoporotic femoral neck. The FA/FF value of 0,915 represents the cut off to discriminate healthy from an osteoporotic femoral neck.
The concordance between MD/FF, FA/FF and DXA methods was equal to 81.1%.
Diagnostic performance of DTI and DTI plus FF protocol
The sensitivity and the specificity for the detection of healthy subjects were 90.9% and 84.6% using MD alone,
while they were 72.7% and 76.9% using FA alone.
Furthermore,
the sensitivity and the specificity for the detection of osteoporotic patients were 75.0% and 82.0% using FA alone,
with 84.6% and 61.9% using FF alone.
As a consequence,
if MD of a single subject is greater than 320 μm2/s,
the subject is identified as a healthy one,
and if FA is less than or higher than 0.74 the subject is identified as an osteopenic or an osteoporotic patient,
respectively (Fig.
3).
The concordance between MD,
FA and DXA methods was equal to 67.6%.Moreover,
the sensitivity and the specificity for the detection of healthy subjects were 100% and 91.3% using MD/FF alone,
with a cut-off value of 422 μm2/s,
while they were 92.3% and 85.7% using FA/FF alone,
with a cut-off value of 0.915 for selecting osteoporotic patients.
The concordance between MD/FF,
FA/FF and DXA methods was equal to 81.1%.(Fig.3)

, osteopenic (OPE) and osteoporotic (OPO) group. (main values).")

 MD evaluation; b) FA evaluation")
 and of an osteoporotic (b) femoral neck . The MD/FF value of 422 µm2 represents the cut off to discriminate an healthy from an osteoporotic femoral neck. The FA/FF value of 0,915 represents the cut off to discriminate healthy from an osteoporotic femoral neck.
The concordance between MD/FF, FA/FF and DXA methods was equal to 81.1%.")