Subjects
Forty Caucasian postmenopausal women (mean age,
68.7±8.9 years; age range,
52-81 years) were recruited.
The eligibility for enrollment was assessed on the base of their BMD measurements and with questionnaires focusing on personal data.
Exclusion criteria: clinical evidence or history of metabolic bone disease; focal lesions of the femur; neoplastic disease; contraindications to the use of MRI; previous hip surgery or irradiation; hip trauma; current use of steroids or hormone replacement therapy; current use of osteoporotic medication based on bisphosphonates.
DXA examination
The forty study subjects underwent femoral densitometry 1-15 days before entering the MR protocol.
BMDs were measured at the level of the left femur and T-scores in femoral neck were calculated for each subjects.
The study population was divided into three groups (3): healthy bone density (study subjects with T-score ≥ -1.0),
osteopenia (-2.5 < T-score < -1.0,),
osteoporosis (T-score ≤ -2.5).
MR protocols
MR investigations were performed using a 3T MR imaging system with a maximum gradient strength of 80 mT/m and a maximal slew rate 400 mT/m/ms.
A 6-channel torso phased-array coil was used.
All the MR pulse sequences used by the radiologists for excluding the presence of potentially confounding bone anomalies and for guiding the placement of the spectroscopic volume of interest (VOI) in the femoral neck,
are listed in Table 1,
together with pulse sequences and scan parameters used for applying DTI and 1H-MRS protocol.
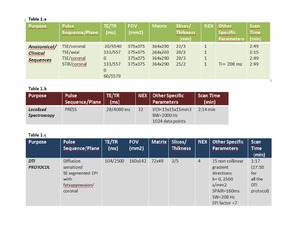
Table 1: Sequences and scan parameters used for: a) anatomical/clinical purpose, b) generating MD and FA maps, c) quantifying FF
We select b=2500s/mm2 to obtain the best compromise between a sufficient SNR of MD and FA maps and a sufficient diffusion weighted to detect slow diffusion regime of bone marrow water restricted between fat and bone [13].
Data analysis
MR spectroscopic data.
All spectra were analyzed using the SpectroView software. FF was calculated for each subject according to the following equation (fig 1):

Fig. 1: Iwat is the water peak area (at about 4.65 ppm) and Ifat is the sum of partially overlapping lipid peaks area (at about 0.9, 1.3, 1.6, 2.0, 2.3, and 2.8 ppm) plus lipid peak area at about 5.3 ppm
For each voxel in the DTI data sets,
MD and FA were calculated.
To measure MD and FA in the femoral neck,
a rectangular (12x15mm) region of interest (ROI) was placed in the femur neck location in b=0 image.
This ROI was then automatically transposed onto two maps (MD and FA) generated by the analysis software (Fig.
2).
MD and FA values of the femoral neck were obtained by averaging the values obtained from the 3 slices selected.
Because both MD and FA are in principle affected by FF as well as BMD,
the normalized DTI parameters,
with respect to the FF variable-MD/FF and FA/FF- were also taken into account.
Reproducibility of DTI measures
In order to document the reproducibility of diffusion parameters MD and FA in femoral neck,
and their short and long-term reliability,
six healthy subjects from the overall study cohort (age range 55–69 years),
were re-scanned on two separate sessions using identical scanning protocols (median 34 days apart).
For each session the same DTI protocol (listed in Table 1) was acquired three times over a period of 1h without repositioning the subject in the MR scanner.
The acquisition time for one DTI run was approximately 18 min.
To determine the short term reproducibility of FA and MD measures in the femoral neck,
we calculated coefficients of variation (CV,
defined as the ratio of the 7 SD to the mean) using the mean and the SD of three consecutively acquisitions obtained for each volunteer.
A paired t-test,
performed on results obtained in the two separate sessions,
was used to assess the long-term reproducibility of the technique.
