_ _RED EARDRUM_ _
1- TYMPANIC AND JUGULAR GLOMUS:
The extraadrenal neuroendocrine system is a complex system made up of chemoregulating tissues dispersed throughout the body.
An isolated focus of such tissue is a paraganglion,
and all these foci considered together constitute the paraganglia.
Paragangliomas are tumors originating in the paraganglia.
As such,
they can occur in many different sites.
Within the head and neck,
the four most common sites are the carotid body at the level of the carotid bifurcation (carotid glomus),
the jugular (jugular glomus),
along the vagus nerve (glomus vagale),
and in the middle ear in relation to the tympanic nerve (tympanic glomus).
√ Otoscopy: pulsatile red retrotympanic mass in lower quadrants.
It is important to assess the status of the fibrocartilaginous ring of the eardrum and the floor of the external ear canal,
because changes to these areas orient the diagnosis toward jugular glomus.
Fig. 4
√ Clinical presentation: Pulsatile tinnitus (90%),
conductive hearing loss,
facial paralysis (5%).
√ Imaging findings:
This is the most common tumor of the middle ear; it presents as a soft-tissue-density mass with its base at the level of the promontory of the tympanic cavity.
The largest ones can erode the bony wall of the middle ear.
The floor of the middle ear is usually spared; a dehiscent or permeative floor suggests a jugulotympanic component.
Contrast-enhanced CT with bone window reconstructions are recommended; MRI should be reserved for cases in which a jugulotympanic component is suspected.
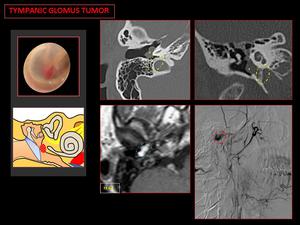
Fig. 5: CT bone: a sessile mass on the cochlear promontory (yellow asterisk). The jugular canal and the floor of the middle ear cavity are intact (yellow circle).
MR T1 Gd: reveals a focal enhancing mass on cochlear promontory (blue circle).
Angiography: shows a small vascular mass (red circle).
This tumor presents as a mass at the level of the jugular foramen.
CT: Lytic permeative bone pattern along the superolateral margin of the jugular foramen.
MRI: Lesions >2 cm present the characteristic “salt and pepper” pattern in T1-weighted sequences,
in which salt refers to hyperintense foci caused by small hemorrhages or areas of slow flow and pepper refers to hypointense foci caused by areas of high arterial flow.
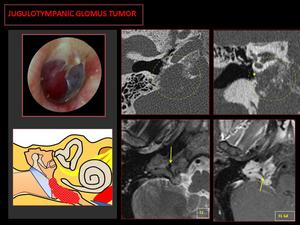
Fig. 6: CT: Lytic-permeative pattern in the jugular foramen (circle), superolateral growth vector toward the middle ear (yellow asterisk).
MR: Salt and pepper pattern, with multiple signal voids inside due to hypertrophic neoplastic vessels (arrows), and intense contrast enhancement.
2- ABERRANT COURSE OF THE INTRAPETROUS CAROTID ARTERY:
Aberrant intracranial internal carotid (ICA) is a congenital vascular anomaly.
√ Otoscopy: red vascular-appearing mass lying in the anteroinferior mesotympanum.
√ Clinical presentation: pulsatile tinnitus or asymptomatic (an incidental finding).
√ Imaging findings:
CT findings are pathognomonic: axial bone CT shows a tubular lesion that crosses the middle ear cavity from the cochlear promontory to rejoin the horizontal petrous ICA.
Fig. 7
Angiography shows the ICA in a more posterolateral course; a distinct angulation resembling a "7" is often present,
together with a change in contour and caliber ("pinched appearance") before the segment resumes its normal course.
Fig. 8
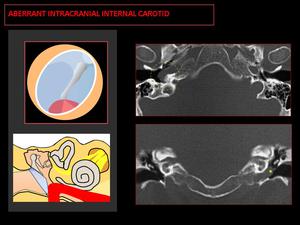
Fig. 7: CT: Tubular structure coursing horizontally from the posterior cochlear promontory to the union with the petrous segment (yellow circle). Coronal-CT shows a soft tissue mass on the cochlear promontory (yellow asterisk).
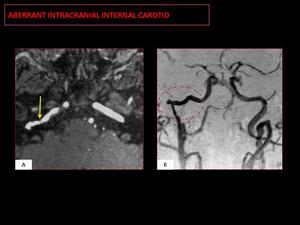
Fig. 8: Angiography: Lateral extension of the petrous segment of the ICA (characteristic “7” shape, red circle). Stenosis at the point where the aberrant ICA joins the petrous segment (arrow).
3- OTOSCLEROSIS:
Otosclerosis is a metabolic bone disease of unknown etiology.
The disease begins with an otospongiotic phase of bone resorption (called otospongiosis) which is followed by an otosclerotic phase when osteoclasts are replaced by osteoblasts and dense sclerotic bone (called otosclerosis).
The process usually starts in the region of the oval window (fenestral otosclerosis); the footplate becomes fixed and produces conductive hearing loss.
It can also occur around the cochlea (retrofenestral otosclerosis).
√ Otoscopy: During the otospongiotic phase,
when an active focus reaches the periosteal surface of the promontory,
a red-pink glow may be seen through the tympanic membrane (Schwartze’s sign).
√ Clinical presentation: unexplained progressive conductive hearing loss in young adults,
twice as common in women than in men.
√ Imaging findings:
CT: In the earlier phase,
CT shows a radiolucent focus involving the oval window.
In the chronic phase,
bone sclerosis appears along the oval window,
which may become occluded by a healed plate.
Fig. 9
MRI: Nonspecific findings.
MRI can show contrast-enhancing punctuate foci in the medial wall of the middle ear.
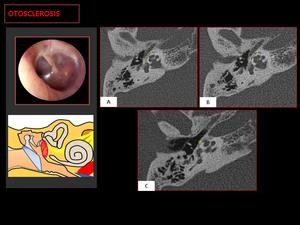
Fig. 9: CT demostrate a case of combined otosclerosis: a otosclerotic fenestral plaque ( 1 ) and retro-fenestral otospongiosis focus ( 2,3 ).
Schwartze’s sign is a reddish retrotympanic image in the region of the promontory, secondary to foci of otospongiosis ( 3 ).
_ _BLUE EARDRUM_ _
1- DEHISCENT JUGULAR BULB:
This is a normal venous variant with superior and lateral extension of the jugular bulb into the middle ear cavity through a dehiscent sigmoid plate.
√ Otoscopy: blue posteroinferior retrotympanic vascular mass.
√ Clinical presentation: asymptomatic (an incidental finding).
√ Imaging findings:
CT shows a focally dehiscent sigmoid plate with a mass protruding into the posteroinferior middle ear; after contrast administration,
the mass shows the same enhancement as the jugular bulb.
Fig. 10
This condition is most often associated with a high riding jugular bulb.
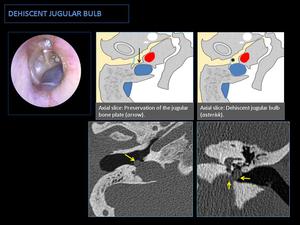
Fig. 10: CT: Superior and lateral extension of the jugular bulb through a dehiscent bone plate into the hypotympanum (yellow arrows). Associated with a high jugular bulb.
2- CHOLESTEROL GRANULOMA:
Cholesterol granulomas form from the response of tissues to cholesterol crystals.
They can develop in any part of the temporal bone,
although they usually arise in the middle ear.
There are two hypotheses about their pathogenesis:
- Obstruction-vacuum hypothesis: the chronic obstruction of the middle ear decreases pressure,
resulting in engorgement of the mucosa and predisposing blood vessels to rupture.
Blood breakdown products,
primarily cholesterol crystals,
cause an inflammatory response.
- Exposed marrow hypothesis: Enlarging mucosa creates bony defects into the hematopoietic marrow,
causing recurrent microhemorrhages.
Blood breakdown to cholesterol crystals incites a foreign cell response and air obstruction secondary to inflammation.
√ Otoscopy: non-pulsatile blue retrotympanic mass (blue eardrum).
√ Clinical presentation: blue eardrum with slow conductive hearing loss in patients with a history of recurrent middle ear otitis.
√ Imaging findings: (Fig. 11)
CT: Nonspecific findings.
Diffuse middle ear mass,
without ossicular loss or bone remodeling.
MRI: The most characteristic finding is the high T1 signal from the paramagnetic effect of extracellular methemoglobin.
T2-weighted sequences show a hyperintense center (granulation tissue) and a hypointense periphery (hemosiderin deposits)*
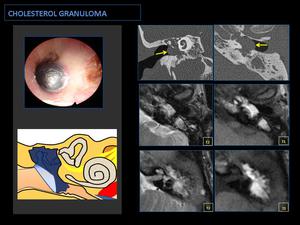
Fig. 11: CT: Diffuse occupation of the middle ear and mastoid cells without bone erosions. Bulging tympanic membrane (arrows).
MR: Hypersignal in T1-weighted sequences is diagnostic, this is due to the paramagnetic effects of extracellular methemoglobin. Differential diagnosis with traumatic hemotympanum (correlation with otoscopic findings!).
*Differential diagnosis with the traumatic hemotympanum:
|
Hemotympanum Fig. 12
Hemotympanum is the accumulation of blood in the middle ear with an intact tympanic membrane secondary to trauma.
Otoscopy shows blood in the middle ear after recent trauma.
Imaging findings:
CT: associated with bone fractures.
MRI: high signal on T1-weighted images secondary to the paramagnetic effect of methemoglobin,
without expansion of the middle ear.
Clinical presentation: acute conductive hearing loss.
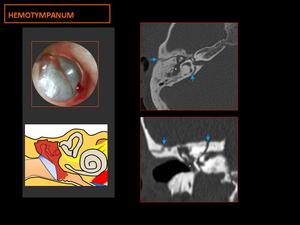 Fig. 12: CT: shows nonspecific occupation of the cavities of the middle ear (yellow asterisk) with two lines of temporal bone fracture, one longitudinal and other transversal (blue arrows).
Bulging tympanic membrane.
|
3- MENINGOCELE AND MENINGOENCEPHALOCELE IN THE MIDDLE EAR:
In meningoceles,
the meninges herniate,
and in meningoencephaloceles,
brain parenchyma also herniates.
Fig. 13
Most cases (58.97%) occur after surgery; 20% of cases are idiopathic,
11.28% occur after trauma,
9.23% after infection,
and 0.51% after radionecrosis.
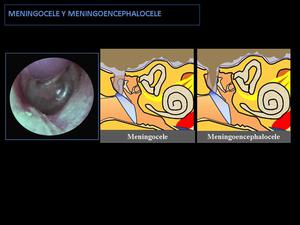
Fig. 13: Schematic image of middle ear meningoencephalocele and meningocele:
They appear as a mass of middle ear associated with a dehiscent tegmen tympani. In the case of meningocele occurs a herniation of the meninges, and in the case of meningoencephalocele occurs a herniation of meninges and brain parenchyma.
√ Otoscopy: a soft,
pulsatile avascular mass protruding through the tegmen.
√ Clinical presentation: asymptomatic (an incidental finding).
√ Imaging findings:
CT shows a mass in the cavities of the middle ear associated with a dehiscence of the tegmen timpani.
MRI orients the diagnosis,
showing: for meningoceles,
a mass with the signal intensity of CSF (hyperintense on T2-weighted sequences and hypointense on T1-weighted sequences) Fig. 14; whereas,
for meningoencephaloceles,
the mass is continuous with brain tissue and isointense with respect to brain tissue. Fig. 15
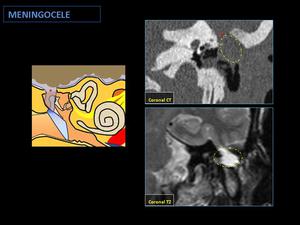
Fig. 14: Postsurgical meningocele:
The CT shows a dehiscent tegmen tympani (red asterisk) and a middle ear mass, with a T2-weighted MR liquid signal like cerebrospinal fluid (circle).
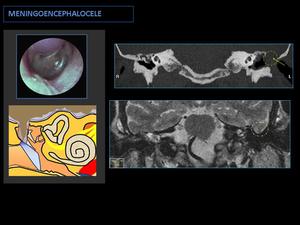
Fig. 15: Postsurgical meningoencephalocele:
CT shows a dehiscent tegmen tympani (arrow) associated with a middle ear soft tissue mass (circle).
MR T2 shows a brain parenchyma herniation into the middle ear cavity.
_ _WHITE EARDRUM_ _
1- CONGENITAL CHOLESTEATOMA:
Congenital cholesteatomas are diffuse middle ear masses formed by aberrant epithelial remnants of exfoliated keratin within stratified squamous epithelium.
They result from abnormal congenital migration of external canal ectoderm to the middle ear cavity beyond the tympanic ring.
They account for only 5% of all temporal bone cholesteatomas.
√ Otoscopy: avascular middle ear mass with an intact tympanic membrane,
although white attic retraction pocket formation is often seen.
√ Clinical presentation: History of recurrent middle ear otitis with conductive hearing loss.
√ Imaging findings:
Common locations are the anterosuperior middle ear (adjacent to the eustachian tube),
posterior epitympanum,
and near the stapes.
CT: A well-circumscribed middle ear mass with ossicular erosions,
although bone erosions are less common than in acquired cholesteatoma.
Fig. 16
MRI: An iso- or hypo-intense mass in T1-weighted sequences,
with peripheral enhancement and intermediate intensity in T2-weighted sequences.
The most characteristic finding is the high signal in diffusion-weighted imaging.
Fig. 17
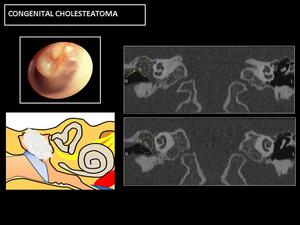
Fig. 16: CT: Soft-tissue occupation, with bone erosions, both in the ossicular chain (circle) and in the bony margins of the cavity, especially in the attic wall (arrow).
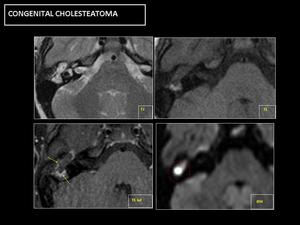
Fig. 17: MR: Hypersignal in diffusion sequences is diagnostic (circle). No enhancement, except in the periphery of the lesion (arrows).
2- BENIGN NONVASCULAR TUMORS OF THE MIDDLE EAR:
These tumors are rare,
and the most typical are:
◊ Adenoma (Fig. 18,
Fig. 19, Fig. 20): Middle ear adenomas are very rare tumors that arise from modified respiratory mucosa.
◊ Schwannoma: Middle ear space schwannomas may originate from the nerves of the tympanic cavity or may originate from other nerves outside the middle air space and extend into the cavity (Fig. 21). Schwannomas arising intrinsically in the middle ear may potentially originate from the facial nerve,
the chorda tympani nerve,
the tympanic branch of the glossopharyngeal nerve (Jacobson’s nerve),
or the auricular branch of the vagus nerve (Arnold’s nerve).
◊ Meningioma: Ectopic meningiomas can arise from arachnoid cells in the middle ear,
secondary to abnormal embryonic migration.
The diagnosis requires a primary intracranial lesion to be ruled out.
√ Otoscopy: White / pink retrotympanic mass.
√ Clinical presentation: Conductive hearing loss.
√ Imaging findings: (nonspecific)
CT: Soft-tissue middle ear mass with a well-pneumatized mastoid (no findings indicative of chronic otitis media).
Meningiomas can present calcifications and permeative-sclerotic changes in affected bone (tegmen timpani or mastoid bones)
MRI: Intermediate signal on T1-weighted sequences and enhancement after contrast administration.
Hyperintense on T2 –weighted sequences.
Meningiomas show strong enhancement associated with a dural tail.
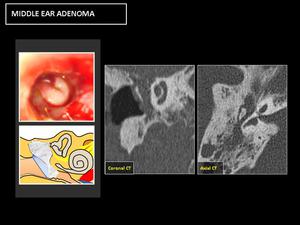
Fig. 18: CT: Nonspecific occupation of the cavities of the middle ear, with sclerotic-hyperostotic changes in the bony margins.
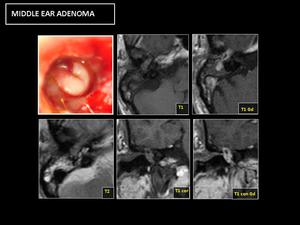
Fig. 19: RM: Diffuse enhancement after contrast administration. No hypersignal in DWI (Differential diagnosis with cholesteatoma).
The definitive diagnosis is histological.
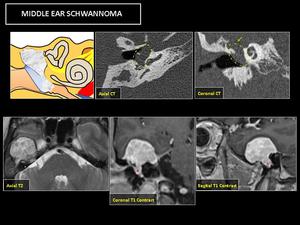
Fig. 21: CT: shows a middle ear soft tissue mass (yellow circle) with bony remodeling and dehiscent tegmen tympani (green arrow), that causes a bulging tympanic membrane.
MR: reveals a lesion with a large intracranial component that extending into middle ear cavity (red asterisk). The lesion presents nonspecific T2 hyperintensity and contrast enhancement.
These lesions have similar clinical and imaging presentations,
and their differential diagnosis is histological.
Fig. 20
3- SEROUS OTITIS MEDIA:
This is defined as the accumulation of fluid in the middle ear with an intact tympanic membrane in the absence of signs and symptoms or acute infection.
The fluid can be mucoid,
serous,
or a combination of the two.
√ Otoscopy: Intact eardrum with air levels or air bubbles inside,
although more chronic cases can present with a bluish eardrum.
√ Clinical presentation: conductive hearing loss.
√ Imaging findings:
Although the diagnosis is usually reached by clinical and otoscopic examination,
CT shows a lesion occupying the middle ear and extending to the eustachian tube in the absence of bone erosions.
Fig. 22
It is important to check the nasopharynx for neoplasms,
especially in adults.
Fig. 23
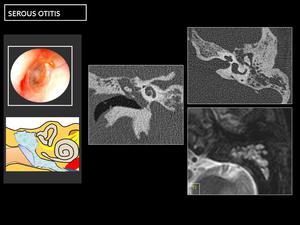
Fig. 22: CT: shows a diffuse and nonspecific middle ear and mastoid cells occupation without bone erosions, and with hyperintense T2 signal.
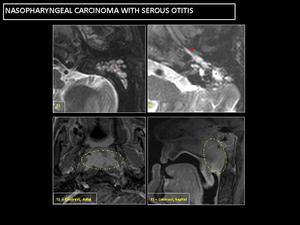
Fig. 23: Inadequate middle ear ventilation causes a diffuse mucoid occupation of the middle ear and mastoid cells, with T2 hyperintensity (red asterisk). Eustachian tube with mucoid material (red arrow).
T1-weighted contrast MRI shows a nasopharyngeal enhancing mass (yellow circle).


. The jugular canal and the floor of the middle ear cavity are intact (yellow circle).
MR T1 Gd: reveals a focal enhancing mass on cochlear promontory (blue circle).
Angiography: shows a small vascular mass (red circle).")
, superolateral growth vector toward the middle ear (yellow asterisk).
MR: Salt and pepper pattern, with multiple signal voids inside due to hypertrophic neoplastic vessels (arrows), and intense contrast enhancement.")
. Coronal-CT shows a soft tissue mass on the cochlear promontory (yellow asterisk).")
. Stenosis at the point where the aberrant ICA joins the petrous segment (arrow).")
 and retro-fenestral otospongiosis focus ( 2,3 ).
Schwartze’s sign is a reddish retrotympanic image in the region of the promontory, secondary to foci of otospongiosis ( 3 ).")

.
MR: Hypersignal in T1-weighted sequences is diagnostic, this is due to the paramagnetic effects of extracellular methemoglobin. Differential diagnosis with traumatic hemotympanum (correlation with otoscopic findings!).")
 with two lines of temporal bone fracture, one longitudinal and other transversal (blue arrows).
Bulging tympanic membrane.")
. Eustachian tube with mucoid material (red arrow).
T1-weighted contrast MRI shows a nasopharyngeal enhancing mass (yellow circle).")

. No enhancement, except in the periphery of the lesion (arrows).")
 and in the bony margins of the cavity, especially in the attic wall (arrow).")
 associated with a middle ear soft tissue mass (circle).
MR T2 shows a brain parenchyma herniation into the middle ear cavity.")
. The positivity of some cells to the anti-enolase neuro-specific antibodies (D) confirmed the neuroendocrine differentiation of these tumors.")
. Associated with a high jugular bulb.")
 and a middle ear mass, with a T2-weighted MR liquid signal like cerebrospinal fluid (circle).")
.
The definitive diagnosis is histological.")

 with bony remodeling and dehiscent tegmen tympani (green arrow), that causes a bulging tympanic membrane.
MR: reveals a lesion with a large intracranial component that extending into middle ear cavity (red asterisk). The lesion presents nonspecific T2 hyperintensity and contrast enhancement.")