PATHOLOGICAL RESULTS (Table2):
- 63 patients with 200 prostate cancer foci
- Mean prostate cancer foci size on DWMR Images was 8.37 mm ± 7.79mm (SD),
range: 4 mm – 28 mm
- Mean prostate cancer foci size on TRUS-guided biopsy was 8.93 mm ± 9.88mm (SD),
range: 0.4 mm – 59 mm
- Mean tumour-to- parenchyma ratio was 30.75% ± 26.85% (SD) range 0.78% – 96%
- Localisations and are Gleason’s grade repartition are reported in Table 2.
Table 2. Characteristics of the population
|
Gleason’s grade
|
DWI size (mm)
Mean ± sd
Range
|
TRUS-guided biopsy
size (mm)
Mean ± sd
Range
|
Ratio (%)
Mean ± sd
Range
|
Localisation
|
|
Right
|
Left
|
|
1
|
2
|
3
|
4
|
1
|
2
|
3
|
4
|
|
Gleason 6
|
3.54 ± 6.10
(7 – 18)
|
2.48 ± 2.16
(0.5 – 10)
|
9.65 ± 11.1
(1.2 – 66.67)
|
10
|
6
|
11
|
0
|
5
|
8
|
6
|
2
|
|
Gleason 7a (3+4)
|
8.46±7.3
(6 – 21)
|
8.75 ± 9.45
(0.4 – 48)
|
29.99±25.93
(1.2 – 66.67)
|
6
|
10
|
7
|
2
|
9
|
13
|
11
|
2
|
|
Gleason 7b (4+3)
|
11.26±7.3
(7 – 25)
|
14.41±12.44
(2 – 59)
|
27.92±3.84
(3.84 – 96)
|
8
|
11
|
8
|
3
|
13
|
13
|
11
|
1
|
|
Gleason>7
|
13.8±7.74
(10 – 28)
|
13 ± 11
(1 – 42)
|
41.08±25.64
(4 – 90)
|
5
|
4
|
1
|
0
|
3
|
5
|
8
|
0
|
|
Gleason > or = 7
|
10.6±7.66
(6 – 28)
|
12.12±10.63
(0.4 – 59)
|
38.74±26.81
(1.2 – 96)
|
19
|
25
|
16
|
5
|
25
|
31
|
30
|
3
|
|
DWI + anapath -
|
11.66± 5.5
(8 – 18)
|
no
|
no
|
0
|
0
|
0
|
1
|
0
|
0
|
0
|
2
|
|
Total
|
30.75±26.85
(0.78 – 96)
|
8.93 ± 9.88
(0.4 – 59)
|
8.88 ± 7.93
(6– 28)
|
29
|
31
|
27
|
6
|
30
|
39
|
36
|
7
|
Note Data are raw numbers,
mean size of the foci on the DW imaging using b value of 2000sec/mm2 and TRUS-guided biopsy in millimetres with standard deviation,
minimum and maximum value,
mean tumor-to-parenchyma ratio on the TRUS-guided biopsy in % with standard deviation,
minimum and maximum value.
Localisation refers to the sextant biopsy: right or left prostate lobe,
1 = basis,
2 = medium,
3 = apex and 4 = anterior prostate zone.
Results are given on a per-patient basis.
DWMR Imaging using b value of 2000sec/mm2 performances for prostate cancer detection (Table 3a):
- Overall: Sensitivity 62.5%,
Specificity 99%,
Accuracy 84.5%
- Gleason > or = 7: Sensitivity 73.7%,
Specificity 99 % Accuracy 90.6%
Table 3a.
Sensitivity,
specificity and accuracy of DW Imaging using a b-value of 2000sec/mm2 in the detection of prostate cancer.
|
Gleason’s grade
Prostate cancer foci
|
Sensitivity (%)
IC95
|
Specificity (%)
IC95
|
Accuracy (%)
IC95
|
|
Gleason > or = 7
|
84.8%
[81.7% - 87.9%]
|
95.4%
[93.6% - 97.2%]
|
92.2%
[89.9% - 94.5%]
|
|
Total
|
69.3%
[65.3% - 73.3%]
|
99%
[98.1% - 99.9%]
|
87.9%
[85.1% - 90.7%] |
Note Data are percentages (%) with IC95,
Sensitivity is defined as True Positive / True positive + False Negative,
Specificity is defined as True negative / True negative + False Positive and Accuracy is defined as True negative + True Positive / True Positive + False Positive + True Negative + False Negative.
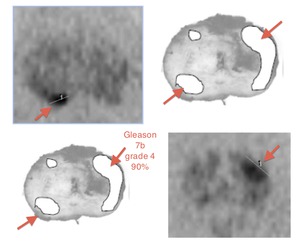
Fig. 2: True positive medium left peripheral (G2) and medium right peripheral Gleason 7b (4+3): correctly detected with b2000 DWMR
Sensitivity of detection of Focal PCa with DWMR using b2000sec/mm2 according to the Gleason’s grade (Table 3b):
- Gleason 6: 27%
- Gleason 7a (3+4): 72%
- Gleason 7b (4+3): 93.9%
- Gleason >7: 92.3%
Table3b.
Performances of DW Imaging using a b-value of 2000sec/mm2 on focal prostate cancer detection.
|
Gleason’s grade
Prostate cancer foci
|
Sensitivity (%)
IC95
|
|
Gleason 6
|
27
[21.6% - 32.4%]
|
|
Gleason 7a (3+4)
|
72
[67% - 77%] |
|
Gleason 7b (4+3)
|
93.9
[91.1% - 96.7%]
|
|
Gleason > 7
|
92.3
[87% - 97.6%]
|
|
Total
|
69.3%
[65.3% - 73.3%]
|
Note Data are percentages (%) with IC95
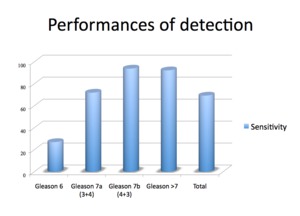
Fig. 6: Performances of DW Imaging using a b-value of 2000sec/mm2 on focal prostate cancer detection.
False negative DW MR Imaging using a b value of 2000 sec /mm2. (Table4a and Fig 1,2,3):
- Gleason 6: 50.7% (35/69)
- Gleason 7a (3+4): 29% (20/69)
- Gleason 7b (4+3): 16% (11/69)
- Gleason >7: 4.3% (4/69)
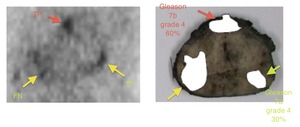
Fig. 4: True False negative medium right peripheral (R2) Gleason 7a (3+4): not correctly detected using b2000 DWMRI
True Positive right anterior (R4) Gleason 7b(4+3): correctly detected using b2000 DWMRI
True Positive medium left peripheral posterior (G2) Gleason 7a (3+4): correctly detected using b2000 DWMRI
Table 4a.
False negative DW Imaging using a b-value of 2000 sec /mm2.
|
Gleason’s grade
Prostate cancer foci
|
False Negative
|
|
Gleason 6
(3+3)
|
35
(50.7%)
|
|
Gleason 7a
(3+4)
|
20
(29%)
|
|
Gleason 7b
(4+3)
|
11
(16%)
|
|
Gleason >7
|
3
(4.3%)
|
|
Gleason >or = 7
|
34
(49.3%)
|
|
Total
|
69
|
Note Data are raw numbers.
False negative are defined as histologicaly proven prostate cancer not detected with Diffusion weighted MR Imaging using a b-value of 2000 sec/mm2.
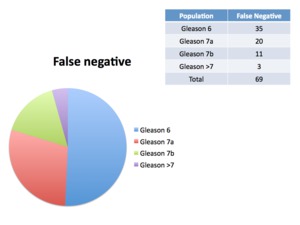
Fig. 7: False negative DW Imaging using a b-value of 2000 sec /mm2.
DW MR Imaging of Gleason’s grade > or = 7 False negative using a b value of 2000sec/mm2. (Table 4b and Fig 1,2,3):
- True false negative: 67.5% (23/34)
- Topographical false negative: 32.5% (11/34)
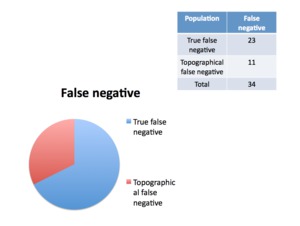
Fig. 9: DW Imaging of Gleason’s grade > or = 7 False negative using a b-value of 2000sec/mm2.
Table 4b.
DW Imaging of Gleason’s grade > or = 7 False negative using a b-value of 2000sec/mm2.
|
Population
|
Gleason’s grade > or = 7 false negative
|
|
True false negative
|
23
(67.5%)
|
|
Topographical false negative
|
11
(32.5%)
|
|
Total
|
34
|
Note Data are raw numbers with percentage.
Topographical false negative is defined as a mismatch between location of a Gleason’s grade > or = 7 prostate foci on pathology and in DW imaging using a b-value of 2000 sec/mm2.
True false negative is defined as histologicaly proven Gleason’s grade > or = 7 prostate cancer foci not detected with Diffusion weighted MR Imaging using a b-value of 2000 sec/mm2.
DW Imaging of Gleason’s grade > or = 7 true false negative using a b value of 2000sec/mm2. (Table 4c.,
5. and Fig 1,2,3):
- Gleason 7a (3+4): 74% (17/23)
- Gleason 7b (4+3): 17% (4/23)
- Gleason >7: 9% (2/23)
- Mean size was 4.97 mm ± 3.94mm (SD),
range: 0.4 mm – 15 mm
- Mean tumour-to-parenchyma ratio was 19.5% ± 26.8% (SD),
range: 0.88% – 83.3%
- Localisations are reported in Table5.
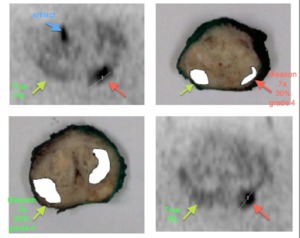
Fig. 5: Right anterior distortion artifact
True positive left medium peripheral (G2) Gleason 7a(3+4) correctly detected using b2000 DWMRI
True False Negative right medium peripheral (R2) Gleason 7a(3+4) not correctly detected using b2000 DWMRI
Table 4c.
True false negative DW Imaging of Gleason’s grade > or = 7 using a b-value of 2000sec/mm2.
|
Gleason’s grade
Prostate cancer foci
|
Gleason’s grade > or = 7
True false negative
|
|
Gleason’s grade 7a
(3+4)
|
17
(74%)
|
|
Gleason’s grade 7b
(4+3)
|
4
(17%)
|
|
Gleason’s grade >7
|
2
(9%)
|
|
Total
|
23
|
Note Data are raw numbers with percentage.
Gleason’s grade > or = 7 True false negative is defined as histologicaly proven Gleason’s grade > or = 7 prostate cancer not detected with Diffusion weighted MR Imaging with b-value of 2000 sec/mm2.
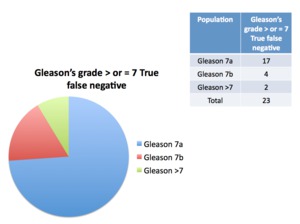
Fig. 8: True false negative DW Imaging of Gleason’s grade > or = 7 using a b-value of 2000sec/mm2.
Table 5. True false negative Gleason > or = 7 W Imaging of Gleason’s grade > or = 7 using a b-value of 2000sec/mm2. Histology proven Gleason’s grade > or = to 7 and negative DW Imaging using a b-value of 2000 sec/mm2.
|
Gleason’s grade Prostate cancer foci
|
Number of foci
(n= )
|
DWI size (mm)
Mean ± sd
Range
|
Ratio (%)
Mean ± sd
Range
|
Localisation
|
|
Right
|
Left
|
|
1
|
2
|
3
|
4
|
1
|
2
|
3
|
4
|
|
Gleason 7a (3+4)
|
17
(74%)
|
5.78±4.46
(0.4 – 15)
|
13.22±11.64
(3.125–28.5)
|
5
|
1
|
2
|
1
|
2
|
1
|
3
|
1
|
|
Gleason 7b (4+3)
|
4
(17%)
|
2.75 ± 1.5
(1 – 4)
|
18.8 ± 26.23
(0.88 – 75)
|
0
|
0
|
0
|
1
|
1
|
2
|
0
|
0
|
|
Gleason >7
|
2
(9%)
|
2.5 ± 2.12
(1 – 4)
|
4
|
1
|
0
|
0
|
0
|
0
|
0
|
1
|
0
|
|
Total
|
23
|
4.97± 3.94
(0.4 – 15)
|
19.5±26.8
(0.88–3.3)
|
6
|
1
|
2
|
2
|
3
|
3
|
4
|
1
|
Note Data are raw numbers with percentage,
mean size of the foci on the DW imaging in millimetres with standard deviation,
minimum and maximum value,
mean tumor-to-parenchyma ratio on the TRUS-guided biopsy in % with standard deviation,
minimum and maximum value.
Localisation refers to the sextant biopsy: right or left prostate lobe,
1 = basis,
2 = medium,
3 = apex and 4 = anterior prostate zone.
Results are given on a per-patient basis.

 and medium right peripheral Gleason 7b (4+3): correctly detected with b2000 DWMR")
 Gleason 7a (3+4): not correctly detected using b2000 DWMRI
True Positive right anterior (R4) Gleason 7b(4+3): correctly detected using b2000 DWMRI
True Positive medium left peripheral posterior (G2) Gleason 7a (3+4): correctly detected using b2000 DWMRI")
 Gleason 7a(3+4) correctly detected using b2000 DWMRI
True False Negative right medium peripheral (R2) Gleason 7a(3+4) not correctly detected using b2000 DWMRI")


