RETROSPECTIVE STUDY (Table1).:
- From May 2011 through September 2012: 63 patients with elevated PSA underwent prostatic MR imaging examination at 3.0-T without endorectal coil including b2000 value DWI sequence study prior to histological examination.
- They all presented at least one focal prostate cancer (Focal PCa) Gleason > or = 7.
- The diagnosis was assessed histopathologically after surgical resection (n=98) or TRUS-guided prostate biopsy (n=168) analysis.
- 29 (46%) patients had Radical prostatectomy and TRUS-guided biopsy,
2 patients (3%) had radical prostatectomy alone and 32 (51%) had TRUS-guided biopsy alone.
- Mean age was 66.1 y-o.
± 7.31(SD) range: 51y-o.
– 80y-o.
- Mean Prostate specific antigen level (PSA) was 15.05 ng/ml ± 30.19 (SD) range: 3ng/ml – 230ng/ml
- Mean delay between MR study and surgery: 2.3 months
Table.1 Characteristics of the population
|
Population
|
Number
of patients
(n= )
|
Age(years)
Mean ± sd
Range
|
PSA(ng/ml)
Mean ± sd
Range
|
Number of foci
(n= )
|
TRUS guided
Biopsy
(n=)
|
Radical prostatectomy
(n=)
|
|
Total
|
63
|
66.1 ± 7.31
(51- 80)
|
15.05±30.19
(3– 230)
|
203
|
168
|
98
|
|
Gleason 6
|
32
|
65.63±6.8
(54- 80)
|
11,3 ± 10,7
(4.7–40)
|
48
(23.7%)
|
44
|
21
|
|
Gleason 7a (3+4)
|
39
|
66.7 ± 7.07
(54-76)
|
9.36 ± 4.56
(3.7–20)
|
60
(29.5%)
|
50
|
33
|
|
Gleason 7b (4+3)
|
34
|
65.57±8.05
(51-78)
|
12.91±3
(3–41)
|
66
(32.5%)
|
49
|
34
|
|
Gleason > 7
|
13
|
67.57±4.64
(63-77)
|
50.66±88.24
(5–230)
|
26
(12.8%)
|
25
|
9
|
|
Gleason > or = 7
|
63
|
66.1±7.31
(51-78)
|
15.05±30.19
(3–230)
|
152
(74.8%)
|
124
|
76
|
|
Unseen
|
3
|
75.66±4.5
(71–80)
|
13.27±6.74
(6.5–20)
|
3
(1.5%)
|
0
|
1
|
Note Data are raw numbers followed by mean age in years with standard deviation,
minimum and maximum value,
mean serum prostate specific antigen level in ng/ml with standard deviation,
minimum and maximum value.
Results are given on a per-patient basis.
Numbers of foci are raw numbers with percentage,
followed by number of prostate cancer foci obtained with trans rectal ultrasound guided biopsy and after radical prostatectomy.
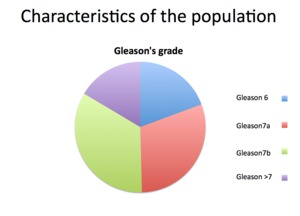
Fig. 1: Characteristics of the population: Gleason grade
MR STUDIES (Fig.2):
3 T MRI system (Magnetom Skyra®,
Siemens Healthcare,
Erlangen,
Germany,
running software Syngovia MR B17).
Using a posterior spine 18 channels coil and an anterior surface 18 channels phased array coil
- The diffusion gradients were applied in three orthogonal directions along the three main axes of the magnet bore (i.
e.,
frequency,
phase and slice select directions).
- The single-shot spni-echo echo-planar imaging readout was preceded by a diffusion-sensitizing block consisting of two 180° radiofrequency pulses.
- b value of 2000 sec/mm2
- Parallel imaging with generalized autocalibrating partially parallel acquisition (GRAPPA) was used with an acceleration factor (or reduction factor) of 2.
- Fat suppression consisted of a spectral adiabatic inversion-recovery (SPAIR) technique.
- The other parameters were as follows:
- repetition time/echo time,
5200 msec/70 msec;
- matrix size 75 x 100; 6/8 partial Fourier acquisition;
- section thickness,
3 mm; intersection gap,
0 mm;
- voxel size,
1.6 x 1.6 x 3 mm;
- field of view 16 mm;
- number of signal averages,
7;
- echo-planar imaging factor,
2;
- receiver bandwidth 1316 Hz/pixel;
- 23 axial sections acquired;
- acquisition time,
2min 15 sec.
- Imaging datasets were reconstructed using a GRAPPA-based algorithm.
Fig2. DW MR protocol at 3-T with a surface Phase array coil.
|
Scan plan
|
Axial prostatic gland
|
|
Sequence
|
SPAIR
Single-shot spin-echo
echo planar imaging
(FS SS EPI)
|
|
Weighted type
|
Diffusion weighted
|
|
TR
|
5200 ms
|
|
TE
|
70 ms
|
|
B-value
|
2000 sec/mm2
|
|
Diffusion direction
|
3D
|
|
Slice thickness
|
3 mm
|
|
Spacing
|
0 mm
|
|
Field of view
|
160mm
|
|
Matrice
|
75 x 100
|
|
Nex
|
7
|
|
N.
Of slice
|
23
|
|
Dir.
Freq
|
R/L
|
|
Coil type
|
ATD torso 18 channels
|
|
Acquisition time
|
2min 15 sec
|
READING METHOD (Fig.3):
Image analysis was performed on the 63 patients in reference to the sextants TRUS-guided biopsy (2) for a total of 504 prostate zones:
- Right and left base (D1 and G1)
- Right and left medial (D2 and G2)
- Right and left apex (D3 and G3)
- and 2 anterior localisation (D4 and G4)
Fig3. DW MR reading method
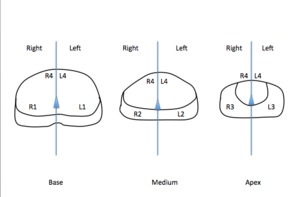
Fig. 3: DW MR reading method
Gleason’s grade repartition is represented on Table1 and Fig1.
- Gleason 6: 23.7%
- Gleason 7a (3+4): 29.5%
- Gleason 7b (4+3): 32.5%
- Gleason >7: 12.8%
Fig.1 Characteristics of the population
Criteria for detection of prostate cancer foci:
On purpose for this study,
the only criteria for Pca detection was an hyperintense focus seen on b2000 without consideration for the results of others sequences,
the localization of the tumor withinthe different prostate zones and ADC values.
The question to answer was: is there any risk to overlook an aggressive lesion using this fast visual assessment of the prostate gland?
According to The ESUR PI-RADS it corresponds to a 5 DWI PI-RADS scoring (3)(Fig.
4,
see results).
MR studies were independently read by two radiologists
In case of discrepancy,
a consensus between the two readers was obtained by a second reading session.
Data were then compared to pathological results after prostatectomy
PATHOLOGY:
TRUS-guided biopsy and radical prostatectomy specimens were examined in the pathology department using Stanford method
Were determined:
- Gleason’s score
- Size of the main neoplastic foci
- Tumour-to-parenchyma ratio on TRUS guided biopsy


