<Anatomy>
[A] Cadaveric microangiograms
The main arterial trunks of the brain supply the cerebrum via basal perforating arteries and pial arteries (1).
From pial arteries over cerebral convexity,
small arteries and arterioles arise including intracortical arteries,
subcortical arteries,
and medullary arteries.
The cortex is supplied from intracortical arteries,
and the subcortical U-fiber region from subcortical arteries and short side-branches of the medullary arteries (Fig.
1).
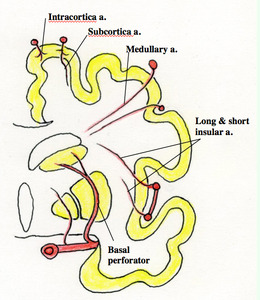
Fig. 1
Fig.
1 Diagram of coronal section of the cerebrum illustrating its vascular supply (Adapted from Moody DM (2))
The cerebral white matter almost entirely receives its blood supply through medullary arteries (3,
4).
These arteries arise at right angles from pial arteries,
run perpendicularly through the cortical layers,
and enter the white matter to reach paraventricular region (Figs.
2 and 3).
They are very thin (100 to 200 μm) and long (20 to 50 mm) especially in the frontal lobe.
The caliber remains unchanged until each vessel ends near the lateral ventricular wall.
The vessels do not arborize but give off perpendicularly oriented short branches,
with a single artery of them providing the blood supply to a cylindrically shaped unit.
Medullary arteries are essentially end arteries in nature,
and therefore have no effective anastomoses with each other or with other arteries,
except in pathological cases (Fig.
4) (5).
The same kind of slender vessels as medullary arteries arise from the insular segment (M2) of the middle cerebral artery and run within the insular subcortical region (external capsule,
claustrum,
and extreme capsule) just outside the lentiform nucleus (6).
They are called insular arteries,
some of which are longer,
and reach as far as the corona radiata (long insular arteries) (Fig.
2).
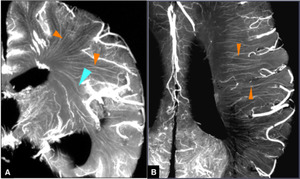
Fig. 2
References: Takahashi S, ed. Neurovascular Imaging: MRI & Microangiography. London: Springer; 2011.
Fig.
2 Microangiograms of the brain demonstrating medullary arteries (Reproduced from Takahashi S (1))
A.
Coronal microangiogram shows a large number of medullary arteries that are very thin and long (orange arrowheads).
They originate from pial arteries over the convexity of the cerebrum and converge toward the superolateral angle of the lateral ventricle as a whole.
Just beneath the medullary arteries from the opercular segment (M3) of the middle cerebral artery,
thin and long arterioles similar to medullary arteries are insular arteries,
some long ones of which are seen to reach the corona radiata (cyan arrowhead).
B.
Axial microangiogram just above the caudate body along the lateral ventricle shows many medullary arteries,
which course almost parallel with each other toward the ventricular wall (orange arrowheads).
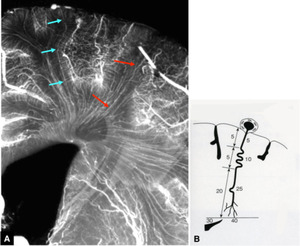
Fig. 3
Fig.
3 Running course and length of medullary arteries
A.
Magnified coronal microangiogram showing the course of medullary arteries that is very thin and long (arrows).
B.
Scheme of a medullary artery (Adapted from Moody et al. (3)).
Arising from a pial artery,
the medullary artery runs toward the ventricular wall about 30 mm deep from the pial surface,
but the total length of the vessel measuring about 40 mm owing to its tortuosity.
The periventricular region may well be said to represent the farthest supply area within the cerebrum.
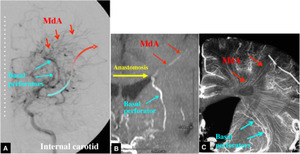
Fig. 4
Fig.
4 Anastomoses between basal perforators and medullary arteries in Moyamoya disease.
A.
Left internal carotid angiography (AP view) shows collateral circulation to the cortical zone via anastomoses between the basal perforators and medullary arteries (MdA).
B.
Partial MIP MR angiogram shows apparent anastomosis between a basal perforator and a medullary artery.
C.
Microangiogram indicates close apposition of the distal ends of basal perforators and medullary arteries.
[B] The distributing pattern of medullary arteries viewed from enlarged perivascular spaces
Distribution of medullary arteries is seen on T2-weighted images as a number of linear or curvilinear hyperintensities that represent enlarged perivascular spaces along the medullary arteries (7),
which course nearly parallel with each other (Figs.
5,
6 and 7).
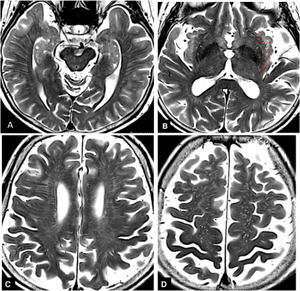
Fig. 5
References: Department of Radiology, Nara Medical University, Japan
Fig.
5 Distribution of enlarged perivascular spaces along medullary arteries on axial T2-weighted images
A,
B,
and C.
Enlarged perivascular spaces of medullary arteries are seen as many linear or curvilinear hyperintensities from the cortex to finally reach the periventricular region.
Short linear hyperintenisties in the insular subcortical region just outside the lentiform nucleus (B) probably represent perivascular spaces of the obliquely running short and long insular arteries (enclosed by a red dotted line).
In the centrum semiovale (D),
perivascular spaces are seen as a number of hyperintense dots,
which represent cross section of the descending medullary arteries from the vertex.
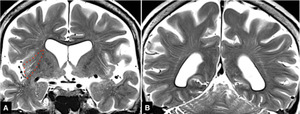
Fig. 6
References: Department of Radiology, Nara Medical University, Japan
Fig.
6 Distribution of enlarged perivascular spaces along medullary arteries on coronal T2-weighted images
Perivascular spaces along the suprasylvian medullary arteries converge toward the superolateral angle of the lateral ventricle,
with those from the vertex side descending to reach the periventricular region.
In the insular subcortical region are obliquely running perivascualr spaces along the insular arteries (enclosed by a red dotted line).
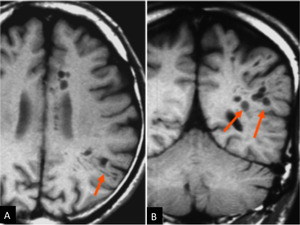
Fig. 7
Fig.
7 Axial (A) and coronal (B) T1-weighted images showing unusually widened perivascular spaces along medullary arteries,
which tend to lie in line corresponding to the course of medullary arteries (arrows).
<Imaging Findings>
Classification of ischemic cerebral injuries/ infarcts in terms of medullary artery circulation (Figs.
8 and 9)
Small vessel disease
Type 1: Ischemic leukoaraiosis
Type 2: Infarcts involving individual medullary arteries
Large vessel disease
Type 3: Deep watershed infarcts in the white matter
Type 4: Territorial infarcts
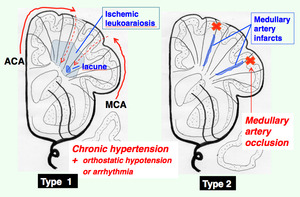
Fig. 8
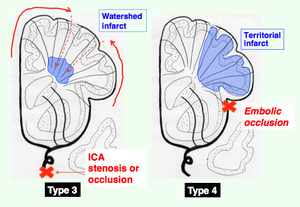
Fig. 9
Figs.
8 and 9 Diagrams illustrating 4 types of ischemic cerebral injuries/ infarcts
(1) Type 1: Ischemic leukoaraiosis
Ischemic leukoaraiosis can be regarded as incomplete infarcted lesions of the white matter often associated with lacunar infarcts in the white matter and/ or basal gray matter (8).
The pathomechanism is not completely clarified but is considered as follows (3,
4).
Normally,
CBF is maintained constant despite changes in systemic arterial blood pressure within a physiological range of blood pressure (mean arterial pressure of 60 to 150 mmHg),
which is called autoregulation: When the blood pressure rises,
the cerebral arterioles constrict,
while they dilate when the blood pressure falls. In hypertensive patients,
however,
the lower limit of autoregulation may be elevated as high as a mean arterial blood pressure of 100-125 mmHg,
presumably due to hypertensive changes in cerebral arterioles or arteriolosclerosis with elongation and increased tortuosity,
which minimize their ability to dilate.
Indeed,
in hypertensives,
the medullary arteries supplying the deep white matter are much lengthened with increased tortuosity (Fig.
10) (3,
9,
10).
Such hypertensive changes involve many medullary arteries which are normally thin and long.
Thus,
transient repeated events with moderate drops in cerebral blood flow (orthostatic hypotension,
arrhythmia and so on) might induce an incomplete form of infarction,
i.e.
ischemic leukoaraiosis,
which may predominates in the most peripheral territory of medullary arteries in the deep white matter (3,
4,
9).
On T2-weighted MR images,
it is shown as patchy or confluent areas of hyperintensity distributed in the white matter often associated with white matter infarcts (Fig.
11).
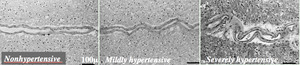
Fig. 10
References: Hiroki M, Miyashita K, Oda M. Tortuosity of the white matter medullary arterioles is related to the severity of hypertension. Cerebrovasc Dis. 2002;13(4):242-50.
Fig.
10 Photomicrograph of the tortuosity of the white matter medullary artery in each WHO stage of hypertension (hematoxylin and eosin stain).
(Courtesy of Hiorki M,
MD,
Tsukuba Medical Center,
Japan)
A.
Nonhypertensive case (stage 0) with almost normal vasculature.
B.
Mildly hypertensive case (stage I) with vessel redundancy or waviness.
C.
Severely hypertensive case (stage III) with more prominent tortuosity with a tight spiral or corkscrew finding.
Note larger vascular diameter with segments of narrowed lumen and a widened perivascular space.
Bars indicate 100 microns.
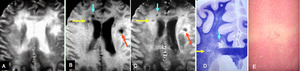
Fig. 11
Fig.
11 Confluent leukoaraiosis with white matter lacunar infarcts
A,
B,
and C.
T2-weighted (A),
T1-weighted (B) and proton density-weighted (C) images of an autopsied brain obtained before formalin fixation show confluent leukoaraiosis predominantly in bilateral frontal white matter.
On T1-weighted and proton density-weighted images,
smaller foci of hypointense signal are scattered within the widespread leukoaraiosis (arrows).
D.
Magnified view of a specimen (Kluver-Barrera stain) shows cavitary foci (arrows) in the deep white matter in right frontal lobe,
which is rarefied.
E.
Photomicrograph (hematoxylin and eosin stain) (x 28) shows an ill-defined focal lesion with atrophic perivascular demyelination around a sclerotic arteriole.
Type 1 lesions or ischemic leukoaraiosis-type white matter lesions are also found in Binswanger's disease and CADASIL (cerebral autosomal dominant arteriopathy with subcortical infarcts and leukoencephalopathy).
Binswanger's disease is a form of dementia secondary to cerebral arteriolosclerosis involving the medullary arteries with resultant severe white matter changes.
MR images show bilateral large irregular or confluent periventricular hyperintensities in the white matter on T2-weighted images often associated with varying degrees of lacunar infarcts (Fig.
12) (11). CADASIL is a small vessel disease with autosomal dominant inheritance caused by mutations in the Notch3 gene on chromosome 19,
and develops at a relatively young age (40-50 years) without risks for stroke (12).
MR imaging reveals patchy and confluent leukoaraiosis of Binswanger type and multiple small infarcts bilaterally in the white matter and basal gray matter (Fig.
13).
Subcortical white matter lesions in the temporal pole are characteristic to this disease.
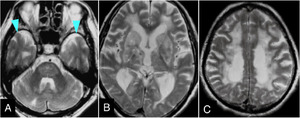
Fig. 12
Fig.
12 Binswanger's disease in a 60-year-old man presenting with gradual progression of staggering,
reduced memory and volition,
and urinary incontinence.
A,
B,
C. Axial T2-weighted images show diffuse leukoaraiosis with multiple foci in the basal ganglia,
thalamus,
and pons,
but temporal subcortical white matter is spared (arrowheads).
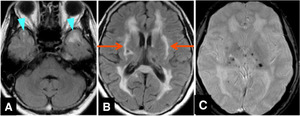
Fig. 13
Fig.
13 CADASIL,
the diagnosis of which was made by skin biopsy,
in a 50-year-old woman.
A and B. FLAIR images show widespread foci of leukoaraiosis with multiple foci of lacunae.
Note involvement of temporal polar white matter (arrowheads) and external capsule (arrows),
which can serve differential diagnosis from ischemic leukoaraiosis or Binswanger's disease.
C. Gradient-echo T2*-weighted image shows multiple microbleeds in the basal gray.
On MRA,
the main trunks of intracranial vessels show no apparent irregularity or stenosis (not shown).
(2) Type 2: Infarcts involving individual medullary arteries
This type of infarcts take a linear/ cylindrical distribution extending from the pial surface toward the ventricular wall.
In our experience,
this type of infarcts have rarely been seen on MR images in cases with a sporadic infarct,
intravascular lymphoma (Figs.
14 and 15),
and after surgical treatments (Figs.
16 - 18).
In case of surgical tumor removal,
attention must be paid to not only important fiber tracts themselves but also their vascular supply (13).
Specifically in insulo-opercular tumors,
every effort should be made so as not to injure many of medullary arteries and long insular arteries to avoid severe postsurgical motor palsy (See legends for Figs.
17 and 18).
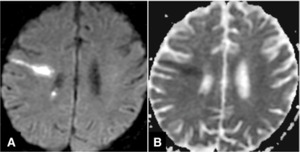
Fig. 14
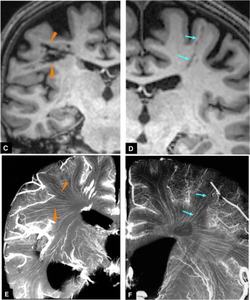
Fig. 15
Figs.
14 and 15 Infarcts involving individual medullary arteries in a 50-year-old man with intravascular lymphoma.
A and B.
Diffusion-weighted image (A) reveals long linear or cylindrically-shaped regions of restricted diffusion (B) that traverses the cerebral hemisphere from the pial surface to the ventricular wall.
C and D.
Coronal T1-weighted images obtained in chronic stage after chemotherapy show multiple discrete linear hypointensities (arrowheads and arrows).
Thus,
each of them is considered to represent an infarcted area presumably due to obstruction of individual medullary arteries,
within the lumina of which angiotropic growth of intravascular lymphoma developed.
E and F. Coronal microangiograms show a close correspondence between the infarcted lesions on C and D and running courses of medullary arteries (arrowheads and arrows).
Compare Figs.
C vs.
E,
and Figs.
D vs.
F.
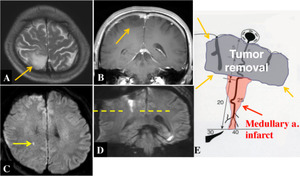
Fig. 16
Fig.
16 Linear infarct along medullary artery after tumor removal.
A and B. Preoperative axial T2-weighted and coronal contrast-enhanced T1-weighted images show right parietal glioma (arrows).
C and D. Postoperatively,
coronal diffusion-weighted image (D) shows that a linear lesion extends downward into the deep white matter from the extirpated cavity,
which is seen as a punctate lesion on axial diffusion-weighted image (arrow in C).
E.
Diagram illustrating how resection of cortical tumors can cause an infarct in the cylindrically-shaped region of a medullary artery under the removal cavity.
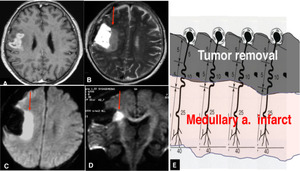
Fig. 17
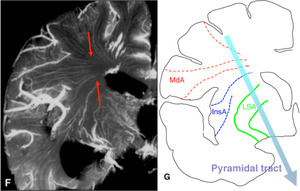
Fig. 18
References: Takahashi S, ed. Neurovascular Imaging: MRI & Microangiography. London: Springer; 2011.
Figs.
17 and 18 Extensive infarct along medullary arteries after tumor removal.
A. Contrast-enhanced T1-weighted image shows an enhancing tumor in right opercular region straddling the central sulcus,
which was resected and turned out to be glioblastoma.
At surgery,
meticulous care was paid to preserve cortical arteries including the central sulcus artery in order to avoid damage to the pyramidal tract.
Postoperatively,
however,
the patient developed left hemiplegia.
B,
C and D.
Immediately postoperative T2-weighted (B) and diffusion-weighted (C) images show an extensive infarct adjacent to the removal cavity (red arrows).
Coronal diffusion-weighted image (D) with motion probing gradient in AP direction indicates that the right pyramidal tract is involved (red arrow).
E. Diagram illustrating how resection of cortical tumors can cause an infarct in the deep white matter under the removal cavity.
Fig.
18
F.
Coronal microangiogram indicates that such an infarct can be caused by damage to the long insular arteries from M2 segment and/or the medullary arteries from pial arteries of M3 and M4 segments of the middle cerebral artery (red arrows).
G.
Diagram illustrating the vascular supply of the pyramidal tract by medullary arteries (MdA),
long insular arteries (InsA),
and lenticulostriate arteries (LSA).
Disruption of either of them can cause damage to the pyramidal tract and resultant contralateral hemiparesis.
Type 2 lesions involving individual medullary arteries may also be caused by very minute emboli or microembolism,
which for example can originate from atheromatous plaque of large arteries,
and move on downstream to the periphery of the medullary arteries with resultant multiple small or miliary lesions (artery-to-artery embolism): These tiny foci tend to be distributed in the deep white matter or watershed zone.
The same mechanism may be working in several other disease states e.g.,
cerebral fat embolism (Figs.
19 and 20),
septic brain embolism (Fig.
21),
hypereosinophilia (14) (Fig.
22),
Trousseau syndrome (15) (Fig.
23),
and others.
Cerebral fat embolism is a serious complication usually after fracture of long bones.
T2-weighted and/or diffusion-weighted images show bright spots diffusely scattered in the area of medullary arteries especially in the watershed zone and in the area of perforating arteries (starfield pattern) (Fig.
19) (16),
whereas T2*-weighted and susceptibility-weighted images reveal minute or punctate hypointense foci mainly in the white matter and corpus callosum,
which indicate microbleeds due to chemical damage to the endothelium of small arteries including medullary arteries (Fig.
20) (17,
18).
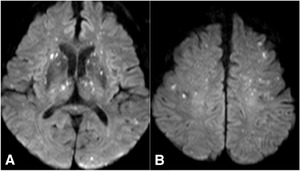
Fig. 19
Fig.
19 Cerebral fat embolism in an 85-year-old man,
which developed after orthopedic treatment for fracture in both lower legs.
He had hypoxemia and disturbance in consciousness that eventually subsided.
A and B. Diffusion-weighted images shows numerous punctate hyperintensities widespread in the basal gray and white matter in both hemispheres (starfield pattern).
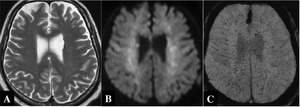
Fig. 20
References: Department of Radiology, Nara Medical University, Japan
Fig.
20 Cerebral fat embolism in a 53-year-old man,
who developed disturbance of consciousness after bone marrow puncture.
A. T2-weighted image only shows ill-defined areas of hyperintensity in the white matter.
B. Diffusion-weighted image show unclear but punctate hyperintensities in the white matter.
C.
Susceptibility-weighted image shows numerous punctate or miliary hypointensities throughout the centrum semiovale,
bilaterally.
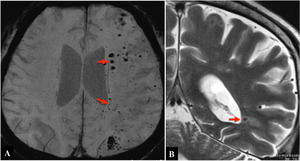
Fig. 21
References: Department of Radiology, Nara Medical University, Japan
Fig.
21 Septic brain embolism (Pseudomonas aeruginosa) in a 56-year-old man with diabetes mellitus and chronic renal failure.
Susceptibility-weighted (A) and T2-weighted image (B) show multiple punctate foci with signal loss or microbleeds (arrows).
The lesions predominate in the deep white matter,
probably in the terminal portions of medullary arteries in the periventricular region.
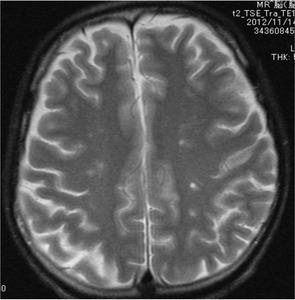
Fig. 22
References: Department of Radiology, Nara Medical University, Japan
Fig.
22 Punctate infarcts found in a case with hypereosinophilia with white cell count being 20,500/microliter with 49% of eosinophils.
T2-weighted image shows multiple tiny foci in the centrum semiovale.
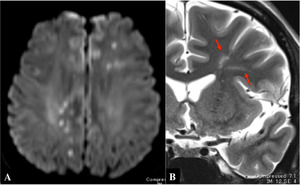
Fig. 23
References: Department of Radiology, Nara Medical University, Japan
Fig.
23 Trousseau syndrome in a 34-year-old man during treatment for renal cancer.
A. Axial diffusion-weighted image shows multiple punctate hyperintensities mainly in the deep white matter bilaterally.
B. Coronal T2-weighted image shows linear or cylindrical area of hyperintensity toward the ventricular wall,
indicating involvement of medullary arterial territories (arrows).
(3) Type 3: Deep watershed infarcts
Deep watershed infarcts are usually caused by hemodynamic mechanism in cases with hypoperfusion,
e.g.,
cervical carotid stenosis/ occlusion (Figs.
24 and 25).
On images,
deep watershed infarcts are seen in the white matter typically in the centrum semiovale,
the farthest supply area of the medullary arteries within the brain.
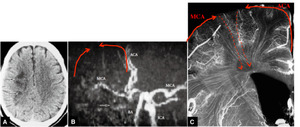
Fig. 24
Fig.
24 Deep watershed infarct in a case with right internal carotid occlusion.
A.
CT shows infarcted foci in right centrum semiovale (arrows).
B.
MR angiography shows right internal carotid occlusion.
ACA: anterior cerebral artery; BA: basilar artery
ICA: internal carotid artery; MCA: middle cerebral artery
C.
Coronal microangiogram indicates that the centrum semiovale around the lateral ventricle represents the last supply area of medullary arteries.
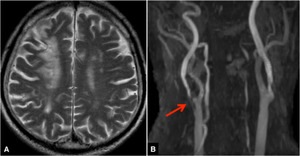
Fig. 25
Fig.
25 Watershed infarct in a case with right internal carotid stenosis.
A.
Axial T2-weighted image shows a watershed infarct in right frontal cortical and white matter region.
B.
MR angiography shows right internal carotid stenosis (arrow).
(4) Type 4: Territorial infarcts
Territorial infarcts are ordinary ones that are caused by truncal and/ or pial artery occlusion,
atheromatous or embolic.
Lesions involve not only cortical gray matter but also the underlying white matter or medullary arteries’ territory (Fig.
26).
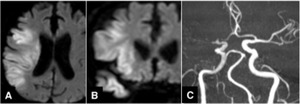
Fig. 26
Fig.
26 Right middle cerebral artery infarct.
A and B. Axial and coronal diffusion-weighted images show a large infarct involving not only cortical zone but also the underlying white matter.
C. MR angiography shows occlusion of right middle cerebral trunk.
