Physicochemical properties of the used TiO2 nanoparticles
The anatase TiO2 nanoparticles were egg-shaped with a medium aspect ratio of 1.12 (according to the appropriate TEM images),
while the rutile nanoparticles were rod-like with aspect ratios up to 6.69 (Table 1).
DLS measurements revealed comparably higher nanoparticle sizes than observed by TEM indicating nanoparticle agglomeration.
All nanoparticles were negatively charged.
They were coated with simethicone (samples #1,
#2 and #6),
alumina (sample #5) or alumina-simethicone (samples #3 and #4).
Moreover,
two samples revealed a secondary shell of esters (samples #2 and #6) and one sample showed the presence of hydrophilic compounds such as polyalcohols (sample #5; Table 1).
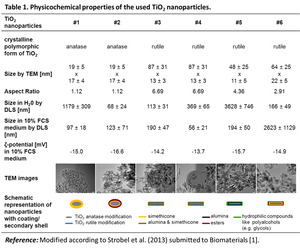
Table 1: Physicochemical properties of the used TiO2 nanoparticles.
References: Modified according to Strobel et al. (2013) submitted to Biomaterials [1].
Metabolic impact of TiO2 nanoparticles on endothelial cells
All the investigated TiO2 nanoparticles revealed only a slight impact on the relative cellular dehydrogenase activity of endothelial cells (Figure 1).
Transient effects (decrease of the dehydrogenase activity) were especially seen at the highest investigated concentration (100 µg/ml).
The anatase TiO2 nanoparticles revealed a small impact on the activity of cellular dehydrogenase (Figure 2A) and a decrease of the relative ATP content (Figure 2B).
Nanoparticles containing a secondary shell of esters had a higher impact on the inflammatory-response compared to nanoparticles without an ester-based shell (Figure 2C).
With respect to the rutile TiO2 nanoparticles,
a surface coating dependent impact on the metabolic activity was observed (Figure 3A-B).
TiO2 nanoparticles with a simethicone-alumina coating (sample #3; sample #4) revealed a gradual decrease in cellular dehydrogenase activity over time.
Particularly,
TiO2 nanoparticles with an alumina (Al2O3) coating and a secondary shell consisting of hydrophilic compounds such as polyalcohols (sample #5) revealed the highest impact on the dehydrogenase activity of endothelial cells (Figure 3A).
TiO2 nanoparticles with an ester-based secondary shell or with an alumina coating and a secondary shell consisting of hydrophilic compounds led to the highest MCP-1 release of endothelial cells (Figure 3C).
Intracellular localization of TiO2 nanoparticles
The uptake of nanoparticles was time dependent and they were localized perinuclearly (Figure 2D & 3D).
Samples without an ester-based secondary shell (samples #1,
#3,
#4,
#5) showed a focal intracellular accumulation,
whereas nanoparticles with an ester-based secondary shell (sample #2 and sample #6) revealed rather diffuse features of accumulation.
Impact of TiO2 nanoparticle crystal structure
Rod-shaped rutile TiO2 nanoparticles led to a higher impact on cell metabolism (stronger decrease of cellular dehydrogenase activity after 48 h and 72 h (Figure 4A) and stronger decrease of ATP content after 24 h and 48 h (Figure 4B)) and revealed a higher pro-inflammatory impact than the elliptical anatase nanoparticles (Figure 4C).
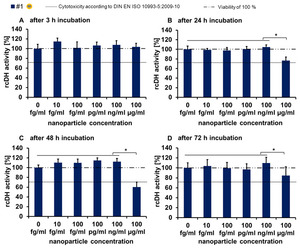
Fig. 1: Concentration and time dependency of cellular dehydrogenase activity after exposure to nanoparticles (representative example with sample #1). Relative cellular dehydrogenase activity (rcDH actitivity) was determined by MTS assay with the CellTiter 96® AQueous One Solution Cell Proliferation Assay Kit (Promega); n = 6 parallels; Asterisks indicate significant differences; P ≤ 0.05. Description of the schematic representation of nanoparticles is found in Table 1.
References: Modified according to Strobel et al. (2013) submitted to Biomaterials [1].
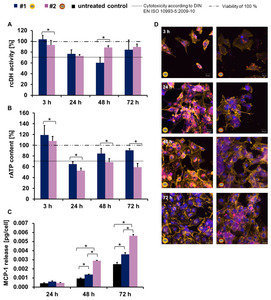
Fig. 2: Metabolic activity and pro-inflammatory response of HMEC-1 after exposure to anatase TiO2 nanoparticles, as well as the intracellular localization of the nanoparticles (c = 100 µg/ml). A) Relative cellular dehydrogenase activity (rcDH actitivity) was determined by MTS assay with the CellTiter 96® AQueous One Solution Cell Proliferation Assay Kit (Promega); n = 6 parallels. B) Relative ATP content (rATP content) deduced by ATP assay with the CellTiter-Glo® Luminescent Cell Viability Assay Kit (Promega); n = 6 parallels. C) MCP-1 release was detected with the Human MCP-1 ELISA Kit (RayBiotech); n = 3 parallels. Asterisks indicate significant differences; P ≤ 0.05. D) Confocal laser scanning microscopic images of HMEC-1 cells after exposure to TiO2 nanoparticles for different incubation times; blue: nucleus (stained with Hoechst 33258); yellow: F-actin (stained with Alexa-Fluor®-546 Phalloidin); red: TiO2 nanoparticles with the fluorescence label N-(2,5-bis(dimethylethyl)phenyl)-N’-(3-(triethoxysilyl)-propyl-perylene-3,4,9,10-tetracarboxylic acid diimide. Description of the schematic representation of nanoparticles is found in Table 1.
References: Modified according to Strobel et al. (2013) submitted to Biomaterials [1].
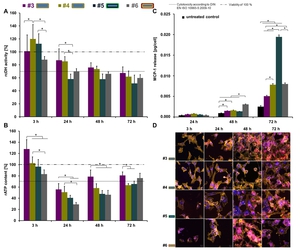
Fig. 3: Metabolic activity and pro-inflammatory response of HMEC-1 after incubation with different rutile TiO2 nanoparticles, as well as the intracellular localization of the nanoparticles (c = 100 µg/ml). A) Relative cellular dehydrogenase activity (rcDH actitivity) was determined by MTS assay with the CellTiter 96® AQueous One Solution Cell Proliferation Assay Kit (Promega); n = 6 parallels. B) Relative ATP content (rATP content) deduced by ATP assay with the CellTiter-Glo® Luminescent Cell Viability Assay Kit (Promega); n = 6 parallels. C) MCP-1 release was detected with the Human MCP-1 ELISA Kit (RayBiotech); n = 3 parallels. Asterisks indicate significant differences; P ≤ 0.05. D) Confocal laser scanning microscopic images of HMEC-1 cells after exposure to TiO2 nanoparticles for different incubation times; blue: nucleus (stained with Hoechst 33258); yellow: F-actin (stained with Alexa-Fluor®-546 Phalloidin); red: TiO2 nanoparticles with the fluorescence label N-(2,5-bis(dimethylethyl)phenyl)-N’-(3-(triethoxysilyl)-propyl-perylene-3,4,9,10-tetracarboxylic acid diimide. Description of the schematic representation of nanoparticles is found in Table 1.
References: Modified according to Strobel et al. (2013) submitted to Biomaterials [1].
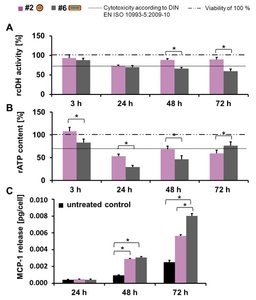
Fig. 4: Comparison of the impact of anatase and rutile TiO2 nanoparticles on HMEC-1 (c = 100 µg/ml). A) Relative cellular dehydrogenase activity (rcDH actitivity) was determined by MTS assay with the CellTiter 96® AQueous One Solution Cell Proliferation Assay Kit (Promega); n = 6 parallels. B) Relative ATP content (rATP content) deduced by ATP assay with the CellTiter-Glo® Luminescent Cell Viability Assay Kit (Promega); n = 6 parallels. C) MCP-1 release was detected with the Human MCP-1 ELISA Kit (RayBiotech); n = 3 parallels. Asterisks indicate significant differences; P ≤ 0.05. Description of the schematic representation of nanoparticles is found in Table 1.
References: Modified according to Strobel et al. (2013) submitted to Biomaterials [1].

 submitted to Biomaterials [1].")
. Relative cellular dehydrogenase activity (rcDH actitivity) was determined by MTS assay with the CellTiter 96® AQueous One Solution Cell Proliferation Assay Kit (Promega); n = 6 parallels; Asterisks indicate significant differences; P ≤ 0.05. Description of the schematic representation of nanoparticles is found in Table 1. References: Modified according to Strobel et al. (2013) submitted to Biomaterials [1].")
. A) Relative cellular dehydrogenase activity (rcDH actitivity) was determined by MTS assay with the CellTiter 96® AQueous One Solution Cell Proliferation Assay Kit (Promega); n = 6 parallels. B) Relative ATP content (rATP content) deduced by ATP assay with the CellTiter-Glo® Luminescent Cell Viability Assay Kit (Promega); n = 6 parallels. C) MCP-1 release was detected with the Human MCP-1 ELISA Kit (RayBiotech); n = 3 parallels. Asterisks indicate significant differences; P ≤ 0.05. D) Confocal laser scanning microscopic images of HMEC-1 cells after exposure to TiO2 nanoparticles for different incubation times; blue: nucleus (stained with Hoechst 33258); yellow: F-actin (stained with Alexa-Fluor®-546 Phalloidin); red: TiO2 nanoparticles with the fluorescence label N-(2,5-bis(dimethylethyl)phenyl)-N’-(3-(triethoxysilyl)-propyl-perylene-3,4,9,10-tetracarboxylic acid diimide. Description of the schematic representation of nanoparticles is found in Table 1. References: Modified according to Strobel et al. (2013) submitted to Biomaterials [1].")
. A) Relative cellular dehydrogenase activity (rcDH actitivity) was determined by MTS assay with the CellTiter 96® AQueous One Solution Cell Proliferation Assay Kit (Promega); n = 6 parallels. B) Relative ATP content (rATP content) deduced by ATP assay with the CellTiter-Glo® Luminescent Cell Viability Assay Kit (Promega); n = 6 parallels. C) MCP-1 release was detected with the Human MCP-1 ELISA Kit (RayBiotech); n = 3 parallels. Asterisks indicate significant differences; P ≤ 0.05. D) Confocal laser scanning microscopic images of HMEC-1 cells after exposure to TiO2 nanoparticles for different incubation times; blue: nucleus (stained with Hoechst 33258); yellow: F-actin (stained with Alexa-Fluor®-546 Phalloidin); red: TiO2 nanoparticles with the fluorescence label N-(2,5-bis(dimethylethyl)phenyl)-N’-(3-(triethoxysilyl)-propyl-perylene-3,4,9,10-tetracarboxylic acid diimide. Description of the schematic representation of nanoparticles is found in Table 1. References: Modified according to Strobel et al. (2013) submitted to Biomaterials [1].")
. A) Relative cellular dehydrogenase activity (rcDH actitivity) was determined by MTS assay with the CellTiter 96® AQueous One Solution Cell Proliferation Assay Kit (Promega); n = 6 parallels. B) Relative ATP content (rATP content) deduced by ATP assay with the CellTiter-Glo® Luminescent Cell Viability Assay Kit (Promega); n = 6 parallels. C) MCP-1 release was detected with the Human MCP-1 ELISA Kit (RayBiotech); n = 3 parallels. Asterisks indicate significant differences; P ≤ 0.05. Description of the schematic representation of nanoparticles is found in Table 1. References: Modified according to Strobel et al. (2013) submitted to Biomaterials [1].")