The Flow Dynamics
Streamline images delineated the vortex and/or helical flow within the dilated ascending aorta throughout the cardiac cycle in all AS patients.
The abnormal flow appears from the base of ascending aorta throughout all cardiac cycle within all AS patients.
On the other hand the flow pattern of the control patients is mostly laminar at systole with brief turbulence while diastole.
This implies an important roll of the AS in the formation of abnormal flow dynamics at systole and subsequent dilatation.
Fig. 1: The streamline and the WSS of a 71-year-old male with AS in a cardiac cycle.
The streamline delineates helical/vortex flow throughout a whole cardiac cycle in the ascending aorta. The WSS around the abnormal flow dynamics is remarkably reduced.
Fig. 2: The streamline and the WSS of a 76-year-old female (control case) in a cardiac cycle.
The flow pattern of the control patients is mostly laminar at systole with brief turbulence while diastole.
The Wall Shear Stress
The Wall Shear Stress (WSS) calculated at the ascending aorta showed reduced WSS less than 0.5 Pa of the wall due to the complex abnormal flow dynamics in all three patients.
In two AS patients partial high WSS appeared on the aortic wall around the vortex and/or helical flow.
The phenomenon might be the consequence of the higher velocity of the vortex and/or helical flow.
Another probable cause may be the discrepancy beteween coordinates of the flow vectors and boundary data derived from phase-averaged enhanced MR angiogram.
Fig. 3: The WSS of an AS patient (the same case as Fig.1) at systole.
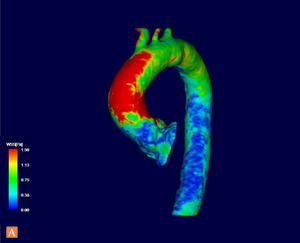
The WSS of the dilated ascending aorta is reduced due to the complex abnormal flow dynamics.
Fig. 4: The WSS at systole of a control case (the same case as Fig.2).
WSS is homogeneously high at the ascending aorta compared to the AS patients.
Fig. 5: Partially high WSS is depicted in the ascending aorta at systole within a 73-year-old male (AS patient).
Fig. 6: The streamline of the AS patient (the case shown in Fig.5) depicts remarkablly high magnitude of vortex and/or helical flow nearby the high WSS portion.
The Oscillatory Shear Index
The Oscillatory Shear Index (OSI) calculated at the ascending aorta showed higher OSI within the dilated portion of ascending aorta (see Fig.10 for the formula).
Partially lower OSI was observed at the dilated ascending aorta in two AS patients.
The phenomenon is probably caused by the shape of the dilated ascending aorta which somehow formed fixed and stable vortex and/or helical flow.
However,
at the bulged portion of the dilatation,
lower WSS and higher OSI are still observed.
These portion of the aorta might be the key for formation of the dilatation within AS patients.
Fig. 7: The OSI of an AS patient (the same case as Fig.1).
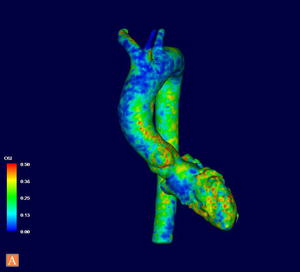
Higher OSI is seen on the wall nearby the complex abnormal flow dynamics.
Fig. 8: The OSI of a control case (the same case as Fig.2).
The calculated OSI of the control group shows stable and low OSI compared to the AS patients.
Fig. 9: Partially lower OSI was observed at the dilated ascending aorta in a 73-year-old AS patient (the same case as Fig.5)
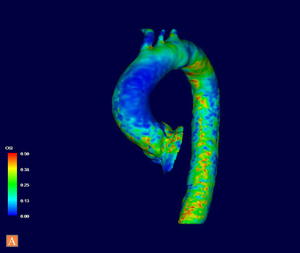
. Higher OSI is still seen at base of the ascending aorta.
Fig. 10: The formula for OSI calculation.