Spectral CT or single source dual-energy CT (ssDECT) by means of fast kVp switching (Gemstone Spectral Imaging,
GE Healthcare,
Milwaukee,
Wisconsin) is a recently introduced scan technique.
Unlike conventional CT,
in which one image is acquired per rotation at a single energy level,
spectral CT or ssDECT acquires two simultaneous images at two different energy levels: a low-energy image at 80 kVP and a high energy image at 140 kVp.
The use of dual energy has two main advantages over conventional single-energy CT.
The first advantage is to create material decomposition or material based images,
usually water and iodine based images.
The water based image or virtual non-contrast image is obtained after iodine-containing pixels are excluded from the image where as in the iodine based images iodine-containing pixels are enhanced.
(Fig 1)
![](https://epos.myesr.org/posterimage/esr/ecr2014/121220/media/524931?maxheight=300&maxwidth=300)
Fig. 1: Iodine based image of a lobular carcinoma of the right breast
The second advantage is the ability to create monochromatic images at selected energy levels that have the possibility of measuring iodine accurately and by plotting the iodine concentration at different energy levels creating spectral attenuation curves that detect the presence of iodine.
[1] (Fig 2-3)
![](https://epos.myesr.org/posterimage/esr/ecr2014/121220/media/524967?maxheight=300&maxwidth=300)
Fig. 2: Monochromatic images of a lobular carcinoma of the right breast
![](https://epos.myesr.org/posterimage/esr/ecr2014/121220/media/527664?maxheight=300&maxwidth=300)
Fig. 3: Spectral HU curve of a lobular carcinoma of the right breast
Spectral CT was performed in the staging of a number of patients with suspected or biopsy proven breast carcinoma and in patients with other indications for the use of spectral CT as possible pulmonary embolism or pleural and pulmonary nodules and tumors.
Due to the use of monochromatic images with different energy levels and color maps spectral CT was able to detect all underlying malignancies in the series of patients with suspected or proven breast malignancy.
Figures 4 and 5 clearly show that spectral CT is superior to conventional CT in detecting breast cancer.
In this case of bilateral nodular gynecomastia spectral CT was able to detect a breast carcinoma in the right breast (Fig 4-5).
![](https://epos.myesr.org/posterimage/esr/ecr2014/121220/media/523807?maxheight=300&maxwidth=300)
Fig. 4: Nodular gynecomastia with right breast cancer. Conventional CT.
![](https://epos.myesr.org/posterimage/esr/ecr2014/121220/media/523808?maxheight=300&maxwidth=300)
Fig. 5: Nodular gynecomastia with right breast cancer. Spectral CT.
Spectral CT can have a possible role in the diagnosis of breast carcinoma,
especially in patients who are unable to have a MRI.
Figure 6 demonstrates a case of a female patient with bilateral breast implants and enlarged right axillary lymph nodes with a negative mammography and ultrasound and unable to have a MRI due to claustrophobia.
Spectral CT with color maps is able to detect a lesion in the lateral part of the right breast with a distinct higher color signal representing iodine enhancement in a breast carcinoma.
![](https://epos.myesr.org/posterimage/esr/ecr2014/121220/media/527617?maxheight=300&maxwidth=300)
Fig. 6: 
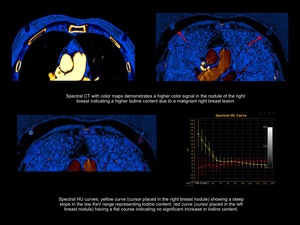
Spectral CT with color maps of a breast carcinoma lateral in the right breast
Spectral CT detects the presence of a malignant breast lesion due to a higher iodine content compared to its surrounding tissue.
Spectral CT is also able to detect a higher iodine content in axillary lymph nodes,
whether this is due to tumor invasion or inflammatory changes has to be further investigated.
Our first experiences in comparing spectral CT findings with pathology proven cases seems to indicate that tumor positive lymph nodes have a higher iodine content then the primary breast cancer itself resulting in a higher slope on the spectral HU curves (Fig 7).
![](https://epos.myesr.org/posterimage/esr/ecr2014/121220/media/529691?maxheight=300&maxwidth=300)
Fig. 7: Spectral HU curves of a positive lymph node and the primary breast carcinoma
The ability to detect iodine content both at the primary tumor site and the lymph nodes can make Spectral CT a suitable tool in the follow up of patients during and after treatment.
Conventional CT can only evaluate tumor size and density as a measure for tumor response to treatment.
Spectral CT can add an extra dimension with detecting and measuring iodine content as a parameter for residual tumor activity after treatment as demonstrated in figures 8-9,
thus giving both morphologic and functional information.
![](https://epos.myesr.org/posterimage/esr/ecr2014/121220/media/533016?maxheight=300&maxwidth=300)
Fig. 8: 
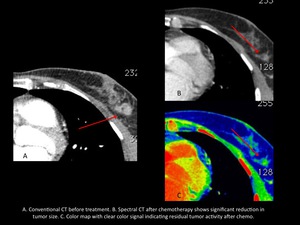
Left breast carcinoma. Conventional CT before treatment and spectral CT after 3 months chemotherapy.
![](https://epos.myesr.org/posterimage/esr/ecr2014/121220/media/533017?maxheight=300&maxwidth=300)
Fig. 9: Enlarged axillary lymph nodes. Conventional CT before treatment and spectral CT after 3 months chemotherapy.