Basic Physics of Susceptibility-weighted imaging (SWI)
Compounds which have paramagnetic,
diamagnetic and ferromagnetic properties all interact with the local magnetic field distorting it and thus altering the phase of local tissue which in turn results in loss of signal.
Paramagnetic compounds include deoxyhaemoglobin,
ferritin and hemosiderin and diamagnetic compounds include bone minerals and dystrophic calcifications.
This new method exploits the susceptibility differences between tissues.
SWI uses a fully velocity compensated,
three dimensional,
rf spoiled,
high-resolution,
3Dgradient echo scan.
Signal from substances with different susceptibilities than their neighbouring tissues (such as venous blood,
or haemorrhage) can manifest contrast in following ways:
First,
tissues with different susceptibilities can be differentiated on phase filtered SWI images alone.
second,
the signal from objects smaller than a voxel like veins will be less(hypointense) than that of its neighbour.
This forms a magnitude image which is exquisitely sensitive to venous blood,
haemorrhage and iron storage.
Larger signal-intensity loss occurs than the actual T2* of the tissue because the signal intensity from the vein can cancel the signal intensity from the gray matter or white matter causing a complete loss of signal intensity at the appropriate TE.
third; phase and magnitude can be combined to absorb both effects.
The term “SWI” implies full use of magnitude and phase information and is not simply a T2* imaging approach.
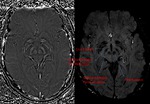
SWI is a unique combination of the following features (Fig.
1 and 2):
- High resolution 3D gradient echo imaging
- Full flow compensation in all three spatial directions to reduce signal losses of blood due to flow-induced dephasing,
leaving us with the desired susceptibility-induced phase.
- Thin slices to remove low-spatial frequency components of the background field.
- Filtering of phase images to reduce unwanted field effects.
- Creating a phase mask image.
- Multiplying the magnitude image with the phase mask.
- Taking a minimum intensity projection over neighbouring slices.
- Processed SWI data
Interpreting SWI Data
There are 3 components to interpret in the SWI data to make a clinical diagnosis
Magnitude image
Two essential points when interpreting the magnitude data
- No large blooming effects are seen because the resolution is high.
- Clearly reveals areas with either short T2* or an oscillatory signal intensity in the magnitude image caused by the presence of deoxyhemoglobin in the major veins.
On magnitude images the veins have a bright signal intensity inside with a hypointense ring around it.
Nevertheless,
following phase-mask multiplication the whole vein appears as a hypointense region in the processed SWI image.
Phase image
First let us understand the Left- and Right-handed coordinate systems(Fig.
3).
Positions in space can be represented in either a left- or right-handed coordinate system,
where one system is a mirror image of the other.
In a right-handed,
the first dimension (often referred to as the x-direction) increases from left to right,
the second dimension goes from posterior to anterior (back to front) and the third dimension increases from inferior to superior (bottom to top).
For a right-handed system,
veins will look dark on the phase image (negative phase) because the deoxygenated blood is paramagnetic relative to its surrounding tissue and calcium will look bright (positive phase) because calcium is diamagnetic relative to the brain tissue.
The reverse is true for a left handed system.
Final processed SWI
This takes full advantage of T2* signal-intensity losses in the magnitude image and iron increases in the phase images to highlight both types of contrast in a single image.
Clinical Applicaions of Susceptibility-weighted imaging in Neuroimaging
1.
Trauma in Adults and Children
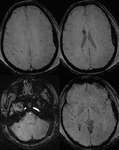
Diffuse Axonal Injury (Fig.
4,5 and 6)
The detection of micro-haemorrhages,
shearing and diffuse axonal injury (DAI) in trauma patients is difficult on conventional imaging.
SWI is particularly helpful for the evaluation of diffuse axonal injury (DAI) associated with punctate haemorrhages in the deep subcortical white matter,
corpus callosum and brainstem.
SWI is 3–6 times more sensitive than conventional T2*-weighted gradient-echo (T2*GE) sequences in detecting the size,
number,
volume,
and distribution of haemorrhagic lesions in DAI. The number and volume of SWI haemorrhagic lesions correlate with specific neuropsychological deficits.
The involvement of the brainstem in TBI is a very important predictor of long term outcome.
Intra-ventricular and Subarachnoid Haemorrhage (Fig.
7 and 8)
SWI also shows intra-ventricular haemorrhage and subarachnoid haemorrhage,
sometimes even better than CT.
By following the resolution of haemorrhage in the brain,
along with spectroscopic imaging,
it may be possible to better monitor the internal improvement of trauma induced coma patients.
2.
Stroke
Diffusion weighted imaging offers a powerful means to detect acute stroke.
Although it is well known that gradient echo imaging can detect haemorrhage,
it is best detected with SWI.
SWI is a complementary sequence and provides additional information by the following:
- Detecting a haemorrhagic component within the region of infarction: The presence of haemorrhage in acute infarct is one of the contraindications of thrombolytic therapy.
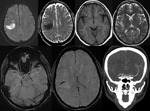
SWI has higher sensitivity than CT and GRE in the detection of haemorrhage in acute ischemic infarct (Fig.9).
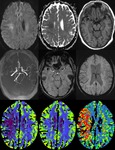
- Demonstrating hypoperfusion by prominent draining veins and directing the necessity of Perfusion imaging (Fig.
10): Uncoupling between oxygen supply and demand in hypoperfused tissue causes a relative increase of deoxyhemoglobin levels and a decrease of oxyhemoglobin in the tissue capillaries and the draining veins.
As deoxyhemoglobin is a paramagnetic substance that induces inhomogeneity of the local magnetic field,
it will result in signal reduction within the draining veins on SWI.
SWI shows prominent hypointense signals in the draining veins within areas of impaired perfusion.
The areas with more prominent veins on SWI are in excellent agreement with the abnormal area on the MTT map. So we can combine DWI and SWI to predict the “mismatch” of diffusion-perfusion.
- Detecting acute thrombus in occluded arteries: In acute stroke,the demonstration of arterial clot with an accurate determination of its location helps to direct thrombolytic treatment.
Acute thrombus contains deoxyhemoglobin therefore,
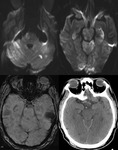
acute arterial thrombosis can be identified on SWI images by what is known as the susceptibility sign. This comprises of a focal hypointense signal in the vessel and apparent enlargement of its diameter,
due to blooming,
related to its paramagnetic properties (Fig.
11,12 and 13).
- Predicting the probability of potential haemorrhagic transformation: SWI can also detect microhemorrhages,
which is a risk factor of haemorrhagic transformation with thrombolytic therapy in acute ischemic stroke.
- Detecting hemorrhagic complication after intraarterial thrombolysis: SWI is sensitive to deoxyhemoglobin and can detect haemorrhagic transformation after an acute infarct.
3.
Brain Tumors
SWI allows improved contrast and detection of both the venous vasculature and haemorrhage within tumors,
which cannot be seen with conventional imaging methods.
Detection of Haemorrhage in Tumors with SWI (Fig.
16)
High-grade tumors such as glioblastomas often have a haemorrhagic component,
which may be useful for staging.
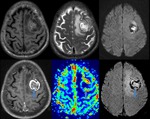
High rCBV values on perfusion imaging and high choline-creatine ratios on MR spectroscopy in tumors is seen in most of the tumors with haemorrhage detected within the tumor matrix on SWI (Fig.
14).
SWI also shows haemorrhage within metastatic lesions.
Many cerebral parenchymal metastatic lesions,
including those from renal cell carcinoma,
melanoma,
and bronchogenic carcinoma,
frequently show intratumoral hemorrhage.
Identifying Tumor Boundaries with SWI (Fig.
14)
SWI clearly shows not only the boundary of the tumor but also different parts of the tumor and hemorrhage inside the tumor.
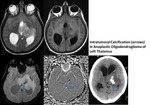
Intratumoral Calcification (Fig.
15)
Calcification is a very important indicator in diagnosis and differential diagnosis of brain tumors.
Calcification cannot be definitively identified by conventional MR imaging because its signals are variable on spin-echo T1- or T2- weighted images and cannot be differentiated fom hemorrhage by gradient images because both will appear hypointense.
However phase images can help differentiate calcification from haemorrhage because calcification is diamagnetic,
whereas haemorrhage is paramagnetic,
resulting in opposite signal intensities on SWI phase images.
4.
Occult Vascular Disease such as Cavernomas and Venous Angiomas
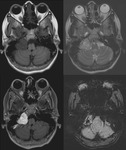
Cavernoma (Fig.
17,
18)
The MR imaging findings of cavernomas is variable,
depending on the presence of haemorrhage and calcifications,
but lesions typically appear as mixed-signal intensities,
often described as “popcorn-like” in appearance,
with a central reticulated core surrounded by a peripheral hypointense rim representing deposition of hemosiderin.
Sensitivity of SWI in identifying the number of lesions is significantly higher than that of T2-weighted fast spin-echo (FSE) and GRE sequences. Also,
because of its high degree of sensitivity,
SWI can help confirm the diagnosis of cavernous malformations in patients presenting with cerebral haemorrhage.
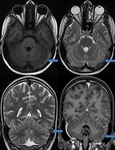
Venous Angioma (Developmental Venous Anomaly)
SWI can demonstrate conspicuously both numerous deep medullary veins and collector veins that are hardly visible on T2-weighted images or proton-attenuation images.
SWI allows better visualization of DVAs without requiring contrast media (Fig.
19,20).
5.
Sturge Weber Syndrome (Fig.
21,22)
SWI is superior to T1-Gadolinium enhanced MRI in characterizing abnormal transmedullary veins,
abnormal periventricular veins,
cortical gyriform hypointensities.
The enlarged regional transmedullary veins have elevated deoxyhemoglobin concentration due to venous stasis and reduced perfusion.
SWI demonstrates presence of abnormally enlarged veins in,
which are thought to provide collateral drainage for venous blood toward the deep cerebral venous system and can become increasingly prominent as surface veins occlude progressively.
The ability to show a redistribution of the venous system by SWI could assist in making decisions about therapeutic intervention.
The location and pattern of the gyriform hypointense lesions in the cortex and the hypointensities at the junction of gray/white matter on SWI images are consistent with the pattern and location of CT findings of calcifications.
6.
Cerebral Venous Sinus Thrombosis (Fig.
23,24)
SWI has become a useful method to evaluate CVST by demonstrating venous stasis and collateral slow flow.
Dural sinus thrombosis causes an increase of deoxyhemoglobin concentration in the involved veins.
This appears as a prominent hypointense signal intensity on SWI.
If the radiologist had missed the direct signs of the thrombosis itself in T1- or T2-weighted imaging,
the engorged veins can alert the radiologist to look for the cause. Venous hypertension can be detected at the early stage of CVST before infarction or haemorrhage occurs.
Thus,
SWI can assist in directing the radiologist to look for CVST while the patient is in the acute stage.
Thrombosed sinuses have deoxyhemoglobin,
which can be readily detected on SWI by the presence of hypointensity and blooming.
Venous infarcts are frequently hemorrhagic and SWI assists in detecting even small hemorrhages in venous infarcts.
7.
Mineralization,
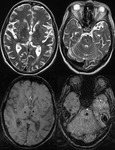
Calcification and Haemorrhage in the Basal Ganglia (Fig.
25,
26 and 27)
The standard method to evaluate mineralization in the basal ganglia has been using Computed Tomography (CT).
Now SWI offers a more sensitive means to pick up abnormalities in iron and calcium in these regions.
8.
Vascular Dementia and Cerebral Amyloid Angiopathy (CAA) Fig.
27,
28
CAA typically results in micro haemorrhages in and around the arteriole vessel wall.
Lobar microbleeds are related to CAA (usually involving the cortex and subcortical white matter within the frontal and parietal lobes),
whereas micro haemorrhages in a deep or infratentorial location typically result from hypertensive or atherosclerotic microangiopathy.
Conventional gradient-echo imaging is a well-established technique for detecting cerebral micro haemorrhages.
However,
25% of patients with CAA did not have evidence of microbleeds on conventional T2*GE images.
SWI is a more sensitive diagnostic tool,
which may permit more precise assessment of the natural history of CAA and response to therapy.
9.
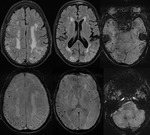
Cerebral Fat Embolism (Fig.
29)
Fat embolism syndrome (FES) is generally associated with displaced long-bone fractures of the lower extremities,
which occur in 0.5–3.5% of cases.
Fat emboli reach the brain through a right-to-left cardiac shunt.
The clinical features of FES include respiratory insufficiency,
neurologic symptoms,
and a petechial skin rash,
confusion to coma and seizures.
Though MRI findings are definite in a given clinical setting they alone are not specific and can be observed in diffuse axonal injury (DAI),
and demyelination. In FES symptoms usually develop 1-3 days after the event.
FLAIR and conventional T2W sequences show multiple diffuse foci of hyperintensity in white matter,
subcortical,
periventricular,
and centrum semiovale regions.
In the majority of cases restricted diffusion foci giving characteristic "star field pattern" are seen in the centrum semiovale.
Susceptibility-weighted imaging (SWI) reveals several punctate foci of low signal intensity representing the micro haemorrhages in the bilateral cerebral and cerebellar white matter,
predominantly in the corticomedullary junction and splenium of the corpus callosum.
10.
Neurodegenerative Disorders
Iron content in the brain increases with age,
particularly in the basal ganglia,
and that abnormal levels of iron in the central nervous system (CNS) are seen in various neurodegenerative diseases.
Increased iron deposition occurs in Parkinson disease,
Huntington disease,
Alzheimer disease,
multiple sclerosis and Hallervorden-Spatz syndrome.
Currently,
phase measured from filtered MR images,
is the most sensitive tool for measuring relative changes in iron content in the subcortical structures of the brain.
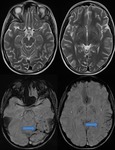
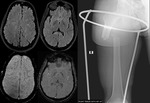
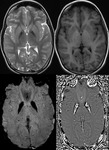
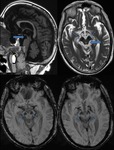
Hallervorden-spatz disease (Fig.
30)
Hallervorden-Spatz syndrome,
now known as pantothenate kinase-associated neurodegeneration (PKAN),
is an autosomal recessive disorder causing involuntary spasticity and progressive dementia. It is a subset of neurodegeneration with brain iron accumulation (NBIA).
MRI findings on T2-weighted MRI images often demonstrate hyperintense changes in anteriomedial part of globus pallidus and hypodense lateral part of globus pallidus and pars reticulata of substantia nigra. SWI / T2* : shows susceptibility artefact (low signal with blooming) in corresponding areas from iron deposition. The "eye of the tiger" sign refers to a central T2 relatively hyperintense spot within the hypointense globi pallidi.
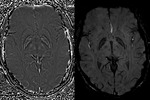
Parkinson disease (Fig.
31)
Lateral substantia nigra pars compacta abnormalities are seen in early Parkinson disease which shows increased iron deposition.
Multiple Sclerosis (Fig.
32,
33)
SWI enables precise in vivo visualization of the venous architecture of the CNS and can help improve our understanding of the pathophysiology by showing typical periventricular distribution of MS lesions.
Chronic MS lesions may show evidence of iron deposition,
which may be better detected by SWI than by conventional GRE.
SWI can show the perivenular distribution of the demyelinating lesions in multiple sclerosis.
This is useful in large tumefactive demyelinating lesions that mimic tumors.
SWI appears to add new perspectives to imaging MS.
Specifically,
SWI sees lesions:
•connected by vessels
•with dark centers
•not seen with FLAIR
•with iron deposition
•of the gray matter
A significantly reduced visualization of periventricular white matter venous vasculature has been found in patients with MS compared to control subjects.
These findings of decreased visibility of veins in periventricular white matter in MS is a result of decreased oxygen utilization in the chronic diseased tissue state of MS and suggests there are to decreased levels of venous deoxyhemoglobin or,
conversely,
higher levels of oxygenated venous haemoglobin.
Alzheimer’s Disease
It is thought that iron around beta amyloid plaque or other sources of iron may be an indication of the early development of Alzheimer’s disease.
Abnormal iron deposition is seen in the motor cortex in early Alzheimer’s disease.
11.
Infections
Neurocysticercosis (Fig.
34)
The SWI phase image associated with the SWI magnitude image shows a 1-to-1 correspondence with the calcifications in the CT scan.
the scolex is readily detected on phase images compared to conventinal sequences.
Fungal Cerebritis (Fig.
35)
Haemorrhagic cerebritis secondary to aspergillus in immunocompromised patients can be seen.
The angioinvasive nature of the aspergillus can cause haemorrhages and infarctions.
The haemorrhage is well seen on susceptibility weighted images.
12.
Ruptured Intracranial Dermoid (Fig.
36)
SWI can show blooming of the fat containing lesion and the disseminated fat droplets in ruptured intracranial dermoid.
Blooming of fat on the susceptibility-weighted images remains speculative.
The causes of blooming on SWI images are not well-established in literature.
Chemical shift artifact as a cause of blooming has been suggested.
13.
Radiation-Induced Changes (Fig.
37)
SWI also appears to be useful by showing haemorrhage at the treatment sites or radiation induced telangiectasia.
14.
Effect of Oxygen on visibilty of veins (Fig.
38)
Breathing normal air has a better visualization of the veins than breathing oxygen because of increase in venous blood oxygenation which leads to a reduction of field inhomogeneities around the vessels. As a result the contrast between veins and surrounding parenchyma is reduced.
15.
Anatomical
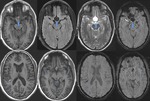
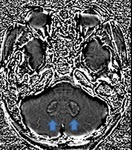
Phase Images of the Mid-Brain and dentate nucleus (Fig.
39,
40)
Increase iron deposition is seen in neurodegenerative diseases.
The iron deposition may correspond to hemosiderin from the ongoing presence of micro-hemorrhages in the aging process. The anatomy of the midbrain and dentate nucleus is also well visualised compared to the conventional MR sequences analogus to the anatomical sections.
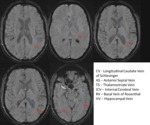
Labeling the Small Veins of the Brain Small Vessel Imaging (Fig.
41)
With SWI one can visualize veins on the order of a few hundred microns with 1 mm3 resolution and image vessels smaller than a voxel,
as small as deep white matter vessels.
Using 3.0T imaging time can be reduced or resolution increased to create images competitive to anatomical brain images.


