The most frequent mistakes in RECIST 1.1 application are related to inaccurate measurements,
inappropriate lesion definition or inadequate imaging techniques stated below:
1.
Assignment of non-qualifying target lesions (number,
size,
pseudolesions)
Despite a clear definition of target lesion number and size to be measured in RECIST 1.1,
assignment of non-qualifying lesions may occur systematically,
such as incorrect inclusion of too small lesions or non-metastatic lesions (Fig.
1A/B).
Definition of non-malignant masses as target lesions,
e.g.
hemangiomas and benign cystic lesions at baseline measurements results in incorrect follow-up and final outcome.
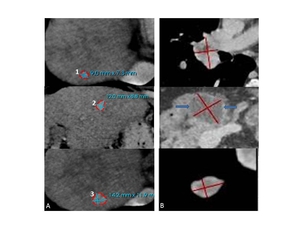
Fig. 1: 49-year-old male with metastatic clear cell renal cell carcinoma. A: Three liver metastases are assigned as target lesions (TL) instead of two. The longest diameter of the 1st lesion is 9mm which does not fulfill RECIST 1.1 criteria. B: Two lung metastases and a cystic lesion in the pancreas (blue arrows on middle image) were assigned as TL. Follow-up examinations proved this cystic pancreas lesion to be an IPMN. Note: cRCC metastases in pancreas usually show a hypervascular and not a cystic character.
Tip1a: Stick strictly to RECIST 1.1 target lesion measurement rules: number= two target lesions per organ maximum, five lesions in total; size = 10mm longest diameter for TL and 15mm longest diameter inshort axis,
perpendicular to long axis for LN.
1b: It is NOT recommended that pseudolesion included in baseline sum is later excluded from follow-up sums since this biases in favor of therapy response.
A new baseline must be created when any lesion is proved non-malignant.
2.
Measurement of irregularly shaped,
non-reproducible targets
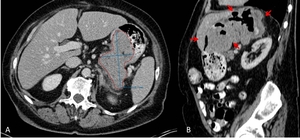
Fig. 2: 52-year-old female with gastric GIST. A: Axial image shows a partial measurement of the gastric lesion which does not reflect the real lesion size: it is to be expected that the size of the lesion varies to a great extent depending on gastric filling (see tumor extend on sagittal reconstruction; B, red arrows).
Tip 2: Primary tumors arising from hollow organs should not be used as a target lesion,
since its longest diameter can hardly be defined on single plane images; it may demonstrate a marked variability in size depending on the filling status of the organ making the lesion non-measurable.
3.
Inclusion of bone metastases
According to RECIST 1.1 lytic or mixed lytic-blastic bone lesions with identifiable soft tissue components (Fig.3) can be considered as measurable target lesions. Pure bone lesions usually do not show any change in size under therapy and thus do not qualify as TL [2].
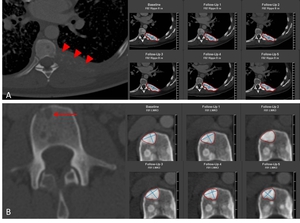
Fig. 3: Skeletal metastases in a 59-year-old male with SCLC. A: Lytic bone metastases in left rib 8 (red arrowheads) and in LWK 3 (B, red arrow) are measured and followed as target lesions only after becoming sclerotic, which represents a good response to therapy in this case
Tip 3: Note that blastic bone lesions are non-measurable according to RECIST 1.1 and thus can only be included as non-target lesions.
Sclerotic change of an originally lytic lesion under therapy indicates a partial response and should not be measured when the soft tissue component is absent.
4.
Evaluation of cystic/necrotic tumor changes
Tumor therapy may induce tumor necrosis while maintaining tumor size or even increase total tumor diameter.
The actively perfused part of the tumor decreases with progressive necrotic areas.
Evaluation criteria like Choi [3,
4] include tumor density following contrast media application for the determination of tumor response.
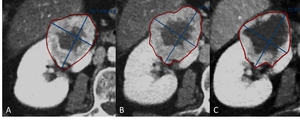
Fig. 4: 49-year-old male with renal cell carcinoma. A: Baseline image shows hypervascular mass with central necrosis at the upper pole of the right kidney. B, C: Follow-up outcome is assessed as a stable disease since there is no change in lesion’s longest diameter. However, increase of central cystic/necrotic changes represents a good response to targeted therapy (Sunitinib).
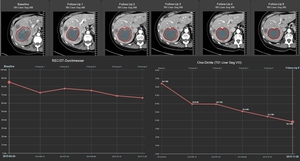
Fig. 5: 52-year-old female with breast carcinoma and hepatic metastases. CT images show necrotic changes of the hepatic target lesion on 5 follow-up examinations. Line charts show average tumor attenuation according to Choi criteria (right) and size according to RECIST criteria (left) over time. Right line chart shows a 15% decrease of HU units between FU 1 and the baseline, qualifying for partial response, while according to RECIST the response indicates stable disease.
Tip 4: Size based criteria have limitations in assessing newer cancer therapies.
Apply Choi criteria for the evaluation of cystic changes after targeted therapies to avoid underestimation of tumor response with RECIST 1.1
5.
Consideration of reappearing lesions as progressive disease
Hepatic metastases of hypervascular tumors (e.g.
carcinoid tumor,
GIST) are often seen only in early or late arterial phase and become iso-attenuating relative to normal liver parenchyma on portal-venous phase and may escape detection.
However,
after treatment,
the hypo-attenuating treated lesions are readily visible on the portal phase images [5].
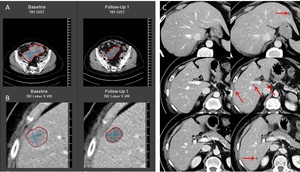
Fig. 6: Hepatic metastases in a 74-year-old male with GIST in the small bowel. Primary tumor (A) and the metastatic target lesion in the liver (B) both show 20% regression 8 weeks after Imatinib® therapy and qualify for partial response outcome. A portal-venous phase post-treatment CT illustrates multiple hypodense liver lesions (D, red arrows) not visible on baseline examination (C). These hypodense lesions should not be interpreted as new lesions and subsequent progressive disease, since they were possibly obscured in portal-venous phase on baseline images and became visible under treatment.
Tip 5: The “apparently new” hypo-attenuating liver lesions on post-treatment CT should be carefully analyzed to avoid misinterpretation of the responding tumors.
Truly reappearing lesions do NOT qualify for a progressive disease.
6.
Definition of Baseline/Nadir as reference
RECIST 1.1 defines Partial Response (PR) as at least 30% decrease in the sum of diameters of target lesions,
taking as reference the baseline sum diameters.
Progressive Disease (PD) is defined as at least 20% increase in the sum of diameters of all target lesions,
taking as reference the ever smallest sum during all follow up studies (Nadir).
The Nadir size is usually considerably smaller than the size at baseline.
The sum must also demonstrate as absolute increase of at least 5mm.
Under these conditions,
PD may appear even if the sum of all TL is smaller than the sum at baseline.
Frequently,
Baseline and Nadir-results are confused in clinical routine; or,
even worse,
recent investigations are only compared to the last previous one.
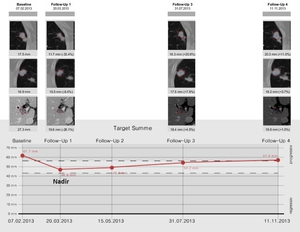
Fig. 7: Hepatic and pulmonary metastases in a 47-year-old female with breast carcinoma. Line chart shows target lesion sum changes from baseline through four follow-up examinations. When FU 4 is compared to the previous examination (FU 3) only, it results in incorrect interpretation of stable disease, while comparison of FU 4 to the smallest sum in FU 1 (Nadir) meets the criteria of PD.
Tip 6: Treatment response outcome may NOT be based on comparison to the previous examination only but correctly referred to either Baseline or Nadir.
Compare: Partial Response → baseline,
Progressive Disease → Nadir
in the study.
7.
Inconsistencies of lesion definition/measurements in follow-up
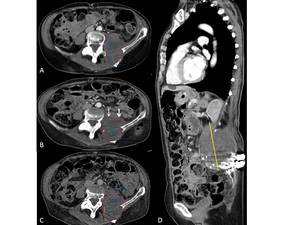
Fig. 8: Fig.8. A: Neuroectodermal retroperitoneal tumor in a 34-year-old male, during FU inconsistently defined as schwannoma. A: left paravertebral lesion is measured partially including m. iliopsoas. B,C: FU scan measurements show inconsistent delineation of the tumor upper border (white arrouws) resulting in incorrect definition of the lesion`s longest diameter and subsequently the response outcome. Paravertebral/paraspinal lesions are better to measure in the sagittal plane (D, [6]).
Tip 7: Keep the tumor definition and measurement delineation constant.
Apply sagittal or coronal reconstructions for TL measurements when superior over the axial planes to avoidfollow-up inconsistencies.
8.
Miscalculation of time-point response (e.g.
mixed response)
Mixed responders and sustained development towards targeted therapies make cancer a chronic disease.
An incomplete assessment of disease progression can result in a late change of therapy,
which in turn might lead to serious consequences for the patient.
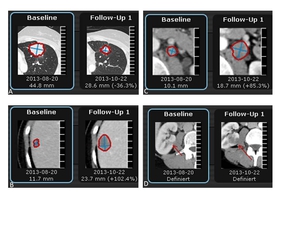
Fig. 9: 52-year-old female with breast carcinoma. A: Follow-up of the pulmonary metastasis show partial response to therapy, while the metastases in the liver (B), retroperitoneal lymph nodes (C) and in the right kidney defined as a finding (D, red arrow), all are suggestive of progressive disease.
Tip 8: Bear in mind that strong regression of a single lesion in mixed responders may mislead the radiologist into assessing the treatment as partial response.
A different selection of RECIST targets and non-targets at baseline might result in earlier assessment of disease progression. Therefore the “big picture” must be kept in mind – which also allows changing the final outcome based on lesion diameters only.
9.
Inconsideration of clinical data or further imaging results outside RECIST follow-up
While FDG-PET/CT response assessments need additional study,
it is sometimes reasonable to incorporate the use of PET-CT scanning to complement CT scanning in assessment of progression [1].
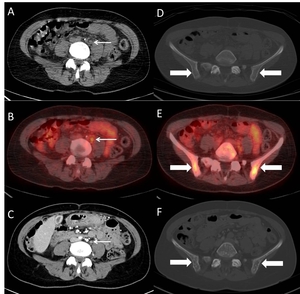
Fig. 10: Skeletal and LN metastases in a 47-year-old female with melanoma. A, D: Retroperitoneal LN and skeletal status is described as normal on baseline CT, while PET-CT one week before (B,E) shows metastatic hypermetabolism in both, LN (white arrow) and pelvic bones (bold arrows). F: Post-treatment CT 3 weeks later shows clearly blastic skeletal metastases.
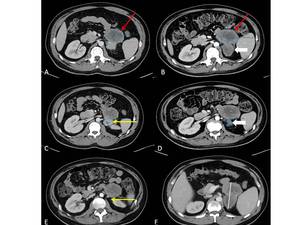
Fig. 11: 33-year-old man with double primary malignancy: Meckel-cell carcinoma and right knie liposarcoma. A, B: Relatively hypodense, left sided retroperitoneal lesion (red arrow) consisting of two components (red and white bold arrows) represents the metastasis from lyposarcoma. While more hyperdence retroperitoneal lesion (C, yellow arrow) is meckel-cell carcinoma metastasis. Disappearance of this lesion after the treatment (E, yellow arrow) meets complete response criteria. However, it is incorrectly identified and described as partial response (D, bold arow), while an investigator measured responding part of liposarcoma metasatsis. Coalescing lesions without a clear plane of separation should be measured together to avoid the confusion on FU measurements (F).
Tip 9: Consider clinical information and other imaging results (e.g.
PET-CT) when relevant to avoid incorrect study outcome.
Note,
however,
that PET portion of CT introduces additional data which may bias an investigator if it is not routinely or serially performed.
10.
Comparison of inconsistent modalities or protocols
Most solid tumors may be scanned with a single-phase sequence after contrast material administration.
However,
multiphasic CT scans are necessary to improve lesion conspicuity for some hypervascular tumors (e.g.,
HCC,
RCC or neuroendocrine tumors) [7-11].
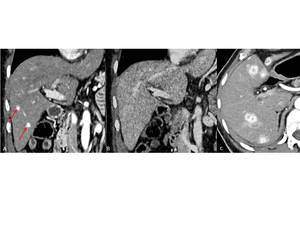
Fig. 12: 63-year-old man with renal cell carcinoma. A: CT scan in arterial phase shows two hypervascular liver metastases (red arrows), which are not visible on follow-up study in portal-venous phase (B). FU 3 months later shows progressive liver metastases in arterial phase (C).
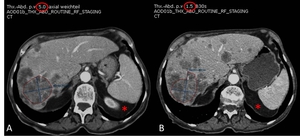
Fig. 13: Hepatic metastases in a 72-year-old male with colon cancer. A: On baseline CT image a confluence liver metastases are chosen as a target lesion which makes this lesion non-reproducible. B: On follow-up study TL is measured on different anatomical level (asterix), with different slice thickness (red circle, 5mm vs 1,5mm) resulting in wrong measurements and subsequently incorrect response outcome.
Tip 10: Keep CT scan parameters and contrast enhancement phases constant in follow-up to avoid misinterpretation of the lesions.
Avoid assignment of confluencing target lesions,
even if they are the largest,
but rather select a smaller lesion that can be measured reproducibly.

 instead of two. The longest diameter of the 1st lesion is 9mm which does not fulfill RECIST 1.1 criteria. B: Two lung metastases and a cystic lesion in the pancreas (blue arrows on middle image) were assigned as TL. Follow-up examinations proved this cystic pancreas lesion to be an IPMN. Note: cRCC metastases in pancreas usually show a hypervascular and not a cystic character.")
.")
 and in LWK 3 (B, red arrow) are measured and followed as target lesions only after becoming sclerotic, which represents a good response to therapy in this case")
.")
 and size according to RECIST criteria (left) over time. Right line chart shows a 15% decrease of HU units between FU 1 and the baseline, qualifying for partial response, while according to RECIST the response indicates stable disease.")
 and the metastatic target lesion in the liver (B) both show 20% regression 8 weeks after Imatinib® therapy and qualify for partial response outcome. A portal-venous phase post-treatment CT illustrates multiple hypodense liver lesions (D, red arrows) not visible on baseline examination (C). These hypodense lesions should not be interpreted as new lesions and subsequent progressive disease, since they were possibly obscured in portal-venous phase on baseline images and became visible under treatment.")
 only, it results in incorrect interpretation of stable disease, while comparison of FU 4 to the smallest sum in FU 1 (Nadir) meets the criteria of PD.")
 resulting in incorrect definition of the lesion`s longest diameter and subsequently the response outcome. Paravertebral/paraspinal lesions are better to measure in the sagittal plane (D, [6]).")
, retroperitoneal lymph nodes (C) and in the right kidney defined as a finding (D, red arrow), all are suggestive of progressive disease.")
 shows metastatic hypermetabolism in both, LN (white arrow) and pelvic bones (bold arrows). F: Post-treatment CT 3 weeks later shows clearly blastic skeletal metastases.")
 consisting of two components (red and white bold arrows) represents the metastasis from lyposarcoma. While more hyperdence retroperitoneal lesion (C, yellow arrow) is meckel-cell carcinoma metastasis. Disappearance of this lesion after the treatment (E, yellow arrow) meets complete response criteria. However, it is incorrectly identified and described as partial response (D, bold arow), while an investigator measured responding part of liposarcoma metasatsis. Coalescing lesions without a clear plane of separation should be measured together to avoid the confusion on FU measurements (F).")
, which are not visible on follow-up study in portal-venous phase (B). FU 3 months later shows progressive liver metastases in arterial phase (C).")
, with different slice thickness (red circle, 5mm vs 1,5mm) resulting in wrong measurements and subsequently incorrect response outcome.")