Imaging technique
At our institution,
musculoskeletal DW imaging is performed using a 1.5 T system (Achieva,
Philips,
Best,
The Netherlands).
An echoplanar sequence is used for diffusion-weighted image acquisition with the following parameters: Repetition time: 4500 ms,
echo time: 105 ms,
directions of the motion-probing gradients: Three orthogonal axes,
b value: 0 and 1000 s/mm2,
field of view: 220 mm,
matrix size: 128 × 80,
section thickness: 5 mm with 0.2 mm intersection gaps and two signals acquired.
Parallel imaging techniques,
sensitivity encoding with a reduction factor of 1-1.5 are used.
In all images a fat-saturated pulse is used to exclude chemical shift artifacts.
The DW images are obtained within an acquisition time of 1-2 min.
Apparent diffusion coefficient (ADC) map is automatically generated on the operating console from concurrent images.
The ADC values are calculated by using the following equation: ADC = −ln (S[b]/ S[0])/b,
where b indicates the b value and S (b) and S (0) are the signal intensities of images with b values equal to 1000 and 0,
respectively.
Image analysis
Diffusion weighted imaging gives qualitative and quantitative information that reflects tissue cellularity and cell membrane integrity (8).
Increased ADC values represent an increase in extracellular water or loss of cell membrane integrity whereas decreased ADC values reflect decrease in extracellular water content or increase in cell number or size (9).
The data obtained from DW imaging should be interpreted using qualitative and quantitative approaches.
Qualitative analysis is visual assessment of the relative tissue signal attenuation and gives quick initial impression about the tumor.
Quantitative analysis is performed by calculating the conventional ADC value.
At our institution,
images are transferred to a workstation (Easy Vision; Philips Medical Systems).
The most solid and/or homogeneous portion of the lesion according to conventional images are selected for measurement.
A region of interest (ROI) is placed around the margin of the suspicious area and the ADC values are obtained with histogram analyses.
When heterogeneity in signal intensity is observed,
it is better to draw multiple small,
at least three,
uniform round or oval ROIs on the ADC map including the areas of enhancing tumor with the lowest ADC determined by visual inspection.
The ROIs position always should be checked with reference to conventional MR images to avoid contamination from different adjacent tissues (Fig.
1,
Fig.
2).
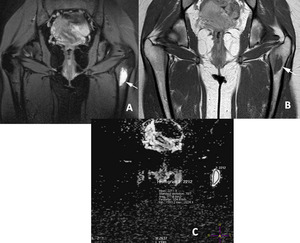
Fig. 1: Quantitative analysis, ROI placement. A. T2- weighted fat-suppressed, B. T1-weighted contrast-enhanced images of a 19-year-old woman with simple bone cyst (arrow). C. On ADC map, The ROI placed around the margin of the lesion and the ADC values are displayed with histogram analysis.
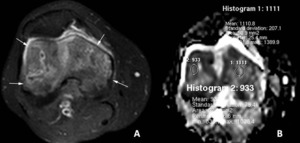
Fig. 2: Quantitative analysis, ROI placement. A. T1-weighted fat-suppressed contrast-enhanced images of a 58-year-old man with bone metastasis from lung adenocarcinoma (arrows). B. On ADC map, heterogeneity in signal intensity is observed and multiple small ROIs placed on the enhancing areas determined by contrast-enhanced images.
The mean ADC values from the area with lowest ADC values are better to select comparison.
The ADC of normal fatty bone marrow is 0 × 10 -3 mm2/s because of the fat suppression technique used for DW imaging.
However,
it can be above 0 in hematopoietic bone marrow.
Normal bone cortex ADC values are also 0 × 10 -3 mm2/s.
Selecting voxels with ADC values of almost 0,
which corresponded to the fatty marrow,
the cortex and tumor calcification or ossification should be avoided.
BONE TUMORS
Most bone tumors have classical radiographic appearance and they can be diagnosed with patient age and clinical data.
But some benign and malignant tumors show atypical findings that need further investigation and some benign lesions in patients with known primary malignancies may constitute a diagnostic problem (7,
10).
There has been no determined ADC cut off value to differentiate benign and malign bone tumors.
Benign cystic bone tumors
Bone cyst and aneurysmal bone cyst are the benign bone tumors that have the highest ADC values (Fig.
3).
Diffusion-weighted imaging is useful in diagnosing benign cystic tumors that have pathologic fractures.
These tumors show high ADC values despite their heterogeneous,
confusing signals on conventional imaging (Fig.
4)
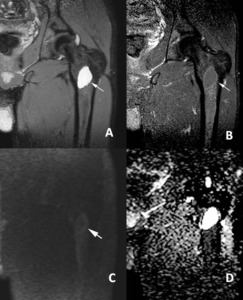
Fig. 3: Simple bone cyst. A. T2- weighted fat-suppressed, B. T1-weighted fat-suppressed contrast-enhanced images of a 24-year-old man with simple bone cyst (arrow). C. Coronal DW image shows low signal intensity (arrow). D. ADC map shows high ADC values, 2.53 x 10⁻³ mm2/s.
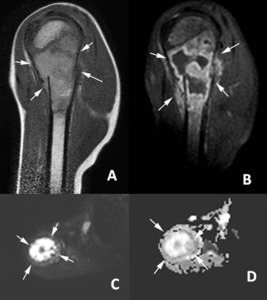
Fig. 4: Aneurysmal bone cyst. A. Sagittal T1- weighted and B. T1-weighted fat-suppressed contrast-enhanced images of a 10-year-old man with aneurysmal bone cyst and pathologic fracture (arrows). C. Axial DW image shows hyperintense signal intensity (arrow). D. ADC map shows increased diffusion of the tumor (arrow), ADC value 2.03 x 10⁻³ mm2/s.
Benign and malignant bone tumors with chondroid matrix
The usefulness of DW imaging in the diagnosis of tumors with chondroid matrix is limited and requires further validation.
Malignant cartilaginous tumors have very high ADC values (11).
Thus,
tumors that have chondroid matrix should be evaluated separately and ADC values should be compared among this group(Fig.5,
Fig.
6,
Fig.
7).
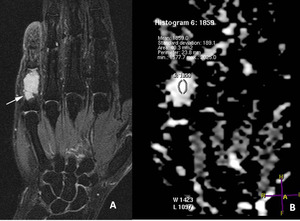
Fig. 5: Enchondroma. A. Coronal T2- weighted fat-suppressed image of a 46-year-old woman with enchondroma (arrow). B. Coronal ADC map shows increased diffusion of the tumor.
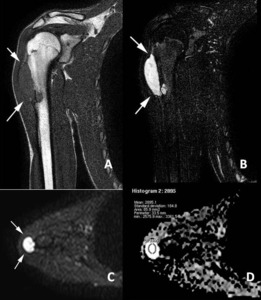
Fig. 6: Chondrosarcoma, low grade. A. Coronal T1- weighted and B. T2-weighted fat-suppressed images of a 20-year-old man with chondrosarcoma (arrows). C. Axial DW image shows very hyperintense signal intensity (arrows). D. ADC map shows increased diffusion of the tumor, ADC value 2.89 x 10⁻³ mm2/s.
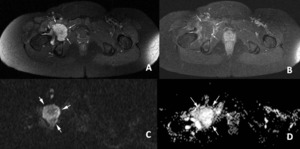
Fig. 7: Chondrosarcoma, high grade. A. Axial T2-weighted fat-suppressed and B. T1-weighted fat-suppressed contrast-enhanced images of a 47-year-old woman with chondrosarcoma (arrows). C. Axial DW image shows hyperintense signal intensity and D. ADC map shows increased diffusion of the tumor (arrows), ADC value 2.18 x 10⁻³ mm2/s.
Benign tumors with low ADC values
Fibrous dysplasia (Fig.
8),
nonossifying fibroma and giant cell tumor (Fig.
9) have lower ADC values than other benign tumors.
This might be related to their histologic features that restrict the diffusion (12).
Low ADC values and high signal in DW images in giant cell tumor could be used to differentiate residue or recurrence of the tumor from postoperative findings (8).
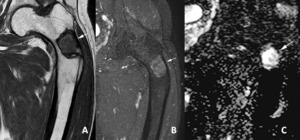
Fig. 8: Fibrous dysplasia. A. Coronal T1- weighted and B. T1-weighted fat-suppressed contrast-enhanced images of a 61-year-old man with fibrous dysplasia (arrow). C. ADC map shows lower ADC values than the other benign tumors, 1.41 x 10⁻³ mm2/s.
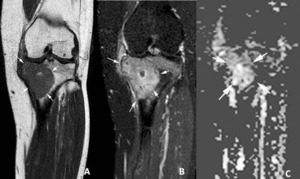
Fig. 9: Giant cell tumor. A. Coronal T1- weighted and B. T1-weighted fat-suppressed contrast-enhanced images of a 27-year-old woman with giant cell tumor (arrow). C. ADC map shows lower ADC values than the other benign tumors, 1.26 x 10⁻³ mm2/s.
Small round blue cell tumors
Small round blue cell tumors (neuroblastoma,
rhabdomyosarcoma,
non-Hodgkin lymphoma and Ewing sarcoma) are a group of undifferentiated aggressive embryonal tumors.
These are the bone tumors that DW imaging and ADC measurement is the most helpful in diagnosis,
monitoring the treatment response and search for residua or recurrence of the tumor (Fig.
10).
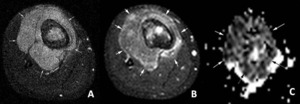
Fig. 10: Ewing sarcoma. A. Axial . T2-weighted fat-suppressed and B. T1-weighted fat-suppressed contrast-enhanced images of a 13-year-old woman with small round blue cell tumor (arrows). C. On ADC map the bone tumor and its large soft tissue component are very hypointense (arrows), ADC value 0.56 x 10⁻³ mm2/s.
Bone metastases
It can be difficult to distinguish benign bone tumors from bone metastases,
especially in patients with solitary bone metastasis (17).
Diffusion weighted imaging may be used as a problem solving tool in these patients.
(Fig.
11)
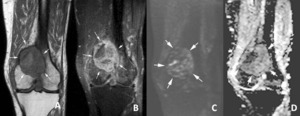
Fig. 11: Solitary bone metastasis in the femur as a presenting sign of clear cell renal cell carcinoma. A. Coronal T1- weighted and B. T1-weighted fat-suppressed contrast-enhanced images of a 76-year-old man with bone metastasis (arrows). C. Coronal DW image the tumor shows hyperintense signal intensity (arrows). D. On ADC map, ADC value is low, 1.02 x 10⁻³ mm2/s.
Tumor-like lesions
Bone marrow edema is characterized by ill-defined medullary infiltration without bone lysis.
It appears hypointense on T1-weighted images and hyperintense on T2-weighted fat-saturated or STIR images and enhanced after injection of gadolinium contrast.
It leads increased ADC values on ADC map.
Although ADC values for bone marrow edema and tumor overlap,
the ADC calculation is a promising tool for the quantification and follow-up of bone marrow edema (Fig.12).
Diffusion weighted imaging may help differentiate tumor borders from perilesional edema (Fig.
13)
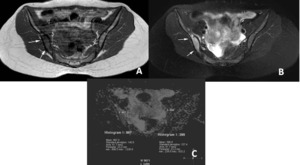
Fig. 12: Bone marrow edema due to stress injury. A. Axial T1- weighted and B. T2-weighted fat-suppressed images of a 20-year-old woman show signal abnormality on the right iliac bone (arrows). C. ADC map shows increased ADC values (0.99 x 10⁻³ mm2/s) when compared the normal left side (0.40 x 10⁻³ mm2/s).
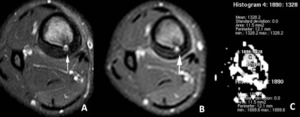
Fig. 13: Osteoid osteoma. A. Axial T2-weighted fat-suppressed and B. T1-weighted fat-suppressed contrast-enhanced images of a 20-year-old with osteoid osteoma (arrow). The lesion has peritumoral edema that is larger than the tumor. C. On ADC map, the ADC values of the lesion (1.90 x 10⁻³ mm2/s) and the peritumoral edema (1.33 x 10⁻³ mm2/s) are shown.
Osteochondroma is the most common benign tumor or tumor-like lesion of bone (Fig.
14).
A cartilage cap more than 1.5 cm thick in a skeletally mature patient has high probability of malignant transformation (12).
Diffusion weighted imaging with ADC maps may have a role to evaluate cartilage cap.
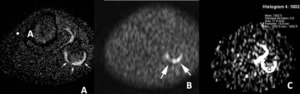
Fig. 14: Osteochondroma. A. Axial T2-weighted fat-suppressed image of a 8-year-old patient with osteocondroma (arrows). B. On axial DW image and C. ADC map the cartilage cap is diffuse hyperintense (arrows), ADC value 1.89 x 10⁻³ mm2/s.
Prominent vascular remnant in the calcaneus is one of the tumor-like lesions that should not be confused with significant pathology and should not be biopsied.
It is characteristically in subtalar location (near the insertion of the cervical and interosseous ligaments) and has an increased T2 and decreased T1 signal (14).
Diffusion weighted imaging may provide additional information in differentiation of this focal signal abnormality from other calcaneal tumors (Fig.
15).
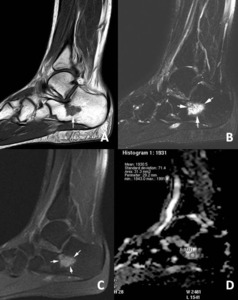
Fig. 15: Prominent vascular remnant in the calcaneus. A. Sagittal T1- weighted, B. T2-weighted fat-suppressed and C. T1-weighted fat-suppressed contrast-enhanced images of a 18-year-old man with focal signal abnormality in subtalar region (arrows). D. On ADC map, ADC value is 1.99 x 10⁻³ mm2/s, lower than bone cyst and higher than malignant tumors.
Soft tissue tumors
It is generally hard to differentiate benign and malignant soft tissue tumors from their signal intensities except for some soft tissue tumors that have unique MR imaging signal and localization like lipoma,
ganglion cyst etc.
Cystic benign and malignant soft tissue tumors
The usefulness of DW imaging in the differentiation of cystic benign tumors from malignant tumors is limited because both have similar ADC values.
(Fig.
16,
Fig.17)
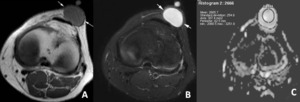
Fig. 16: Epidermal cyst in the anterior knee. A. Axial T1- weighted, B. T2-weighted fat-suppressed images of a 17-year-old man with cystic benign lesion (arrows). C. On ADC map, the lesion displays very high ADC values, 2.66 x 10⁻³ mm2/s.
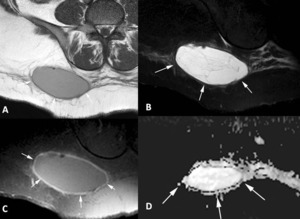
Fig. 17: Pleomorphic liposarcoma in the gluteal region. A. Axial T1-weighted, B. T2-weighted fat-suppressed and C. T1-weighted fat-suppressed contrast-enhanced images of a 39-year-old woman with cystic malignant soft tissue tumor (arrows). D. On ADC map, the lesion shows very high ADC values, 2.79 x 10⁻³ mm2/s.
Solid and partly solid soft tissue tumors
Solid benign tumors have lower ADC values than cystic tumors and higher ADC values than malignant solid soft tissue tumors (Fig.
18,
Fig.
19)
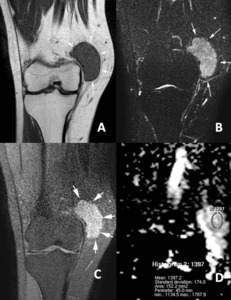
Fig. 18: Hemangioma. A. Coronal T1-weighted, B. T2-weighted fat-suppressed and C. T1-weighted fat-suppressed contrast-enhanced images of a 41-year-old man with benign solid soft tissue tumor (arrows). D. On ADC map, the lesion shows ADC value lower than cystic lesions, 1.32 x 10⁻³ mm2/s.
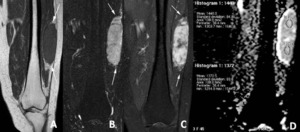
Fig. 19: Schwannoma. A. Coronal T1-weighted, B. T2-weighted fat-suppressed and C. T1-weighted fat-suppressed contrast-enhanced images of a 62-year-old woman with benign solid soft tissue tumor (arrows). D. On ADC map, the lesion shows ADC value lower than cystic lesions.
Measurement of the ADC values on DW imaging is a promising tool for monitoring the treatment response of primary sarcomas (15,
16).
Diffusion weighted imaging may also used for differentiation between residual or recurrent tumors and postoperative changes in soft tissues.
Metastases and tumor recurrence,
even small ones,
can be easily appreciated on DW images and corresponding ADC maps (Fig.
20,
Fig.
21).
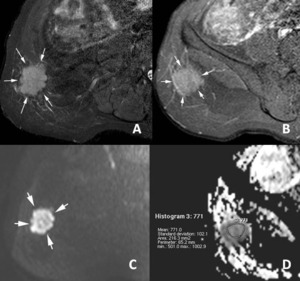
Fig. 20: Soliter soft tissue metastasis from lung adenocarcinoma. A. Axial T2-weighted fat-suppressed and B. T1-weighted fat-suppressed contrast-enhanced images of a 59-year-old man with malignant solid soft tissue tumor (arrows). C. On axial DW image and D. ADC map the lesion is more noticeable (arrows), ADC value 0.77 x 10⁻³ mm2/s.
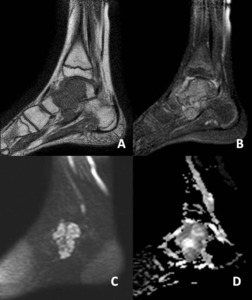
Fig. 21: Local recurrence of synovyal sarcoma. A. Sagittal T1-weighted and B. T1-weighted fat-suppressed contrast-enhanced images of a 27-year-old man with recurrent soft tissue sarcoma (arrows). C. On sagittal DW image and D. ADC map the lesion is more noticeable (arrows), ADC value 0.81 x 10⁻³ mm2/s.
Tumor-like lesions
Chronic hematoma may be misdiagnosed as a malignant soft tissue tumor because of its large size,
slow progressive enlargement and enhancement on contrast-enhanced images.
Diffusion weighted imaging may be useful for differentiating between hematomas and malignant soft tissue tumors (4,
5).
(Fig.
22,
Fig.
23)
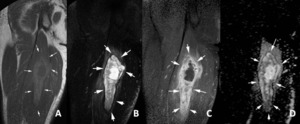
Fig. 22: Chronic hematoma in the thigh. A. Coronal T1-weighted, B. T2-weighted fat-suppressed and C. T1-weighted fat-suppressed contrast-enhanced images of a 28-year-old man with partly solid soft tissue mass (arrows). The lesion is well-defined and and surrounded with peripheral rim of low intensity and peritumoral edema. D. On ADC map the lesion shows ADC values higher than malignant soft tissue tumors, 2.31 x 10⁻³ mm2/s.
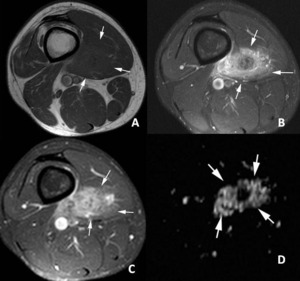
Fig. 23: Rhabdomyosarcoma in the thigh. A. Axial T1-weighted, B. T2-weighted fat-suppressed and C. T1-weighted fat-suppressed contrast-enhanced images of a 27-year-old man with malignant solid soft tissue mass (arrows). D. On ADC map the lesion shows low ADC values, 0.95 x 10⁻³ mm2/s.
Limitations and future directions
- Current data about DW imaging in bone and soft tissue tumors is limited by the small number of studies with small cohort of patients.
There has been no determined cut-off value to differentiate benign from malignant tumors.
Larger cohort studies are needed
- Benign and malignant bone tumors with chondroid matrix have very high ADC values.
These tumors should be evaluated as a different group.
- It seems not possible to differentiate cystic malignant soft tissue tumors from benign cystic tumor with DW imaging.
- The echo-planar technique allows rapid acquisition that reduces artifacts due to patient motion.
But it has some magnetic susceptibility artifacts and geometric distortions.
Improvement in DW imaging techniques is needed.
- Interobserver variability in ADC mean value measurement is still a problem.

. C. On ADC map, The ROI placed around the margin of the lesion and the ADC values are displayed with histogram analysis.")
. B. On ADC map, heterogeneity in signal intensity is observed and multiple small ROIs placed on the enhancing areas determined by contrast-enhanced images.")
. C. Coronal DW image shows low signal intensity (arrow). D. ADC map shows high ADC values, 2.53 x 10⁻³ mm2/s.")
. C. Axial DW image shows hyperintense signal intensity (arrow). D. ADC map shows increased diffusion of the tumor (arrow), ADC value 2.03 x 10⁻³ mm2/s.")
. B. Coronal ADC map shows increased diffusion of the tumor.")
. C. Axial DW image shows very hyperintense signal intensity (arrows). D. ADC map shows increased diffusion of the tumor, ADC value 2.89 x 10⁻³ mm2/s.")
. C. Axial DW image shows hyperintense signal intensity and D. ADC map shows increased diffusion of the tumor (arrows), ADC value 2.18 x 10⁻³ mm2/s.")
. C. ADC map shows lower ADC values than the other benign tumors, 1.41 x 10⁻³ mm2/s.")
. C. ADC map shows lower ADC values than the other benign tumors, 1.26 x 10⁻³ mm2/s.")
. C. On ADC map the bone tumor and its large soft tissue component are very hypointense (arrows), ADC value 0.56 x 10⁻³ mm2/s.")
. C. Coronal DW image the tumor shows hyperintense signal intensity (arrows). D. On ADC map, ADC value is low, 1.02 x 10⁻³ mm2/s.")
. C. ADC map shows increased ADC values (0.99 x 10⁻³ mm2/s) when compared the normal left side (0.40 x 10⁻³ mm2/s).")
. The lesion has peritumoral edema that is larger than the tumor. C. On ADC map, the ADC values of the lesion (1.90 x 10⁻³ mm2/s) and the peritumoral edema (1.33 x 10⁻³ mm2/s) are shown.")
. B. On axial DW image and C. ADC map the cartilage cap is diffuse hyperintense (arrows), ADC value 1.89 x 10⁻³ mm2/s.")
. D. On ADC map, ADC value is 1.99 x 10⁻³ mm2/s, lower than bone cyst and higher than malignant tumors.")
. C. On ADC map, the lesion displays very high ADC values, 2.66 x 10⁻³ mm2/s.")
. D. On ADC map, the lesion shows very high ADC values, 2.79 x 10⁻³ mm2/s.")
. D. On ADC map, the lesion shows ADC value lower than cystic lesions, 1.32 x 10⁻³ mm2/s.")
. D. On ADC map, the lesion shows ADC value lower than cystic lesions.")
. C. On axial DW image and D. ADC map the lesion is more noticeable (arrows), ADC value 0.77 x 10⁻³ mm2/s.")
. C. On sagittal DW image and D. ADC map the lesion is more noticeable (arrows), ADC value 0.81 x 10⁻³ mm2/s.")
. The lesion is well-defined and and surrounded with peripheral rim of low intensity and peritumoral edema. D. On ADC map the lesion shows ADC values higher than malignant soft tissue tumors, 2.31 x 10⁻³ mm2/s.")
. D. On ADC map the lesion shows low ADC values, 0.95 x 10⁻³ mm2/s.")