ECR 2015 / B-0211
Does the synthesised digital mammography (3D-DM) change the ACR density pattern?
This poster is published under an open license. Please read the disclaimer for further details.
Congress:
ECR 2015
Poster Number:
B-0211
Type:
Scientific Paper
Keywords:
Breast, Mammography, Diagnostic procedure, Cancer
Authors:
P. MARTÍNEZ MIRAVETE1, M. Millor Muruzábal2, P. García-Barquín2, A. Elizalde2, L. J. Pina Insausti2, J. Etxano2, P. Bartolomé2; 1Zaragoza/ES, 2Pamplona/ES
DOI:
10.1594/ecr2015/B-0211

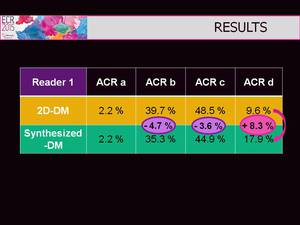
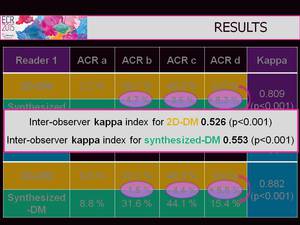
Fig. 2:
Results of reader 1.

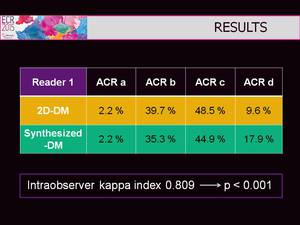
Fig. 3:
Intraobserver kappa index of reader 1.

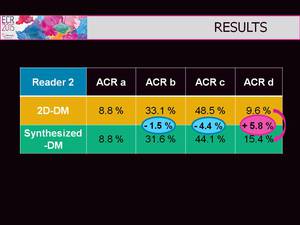
Fig. 4:
Results of reader 2.

Fig. 5:
Intraobserver kappa index of reader 2.

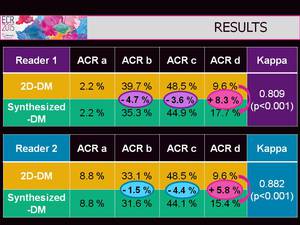
Fig. 6:
Summary of the results of both readers.

Fig. 7:
Intraobserver kappa indexes.

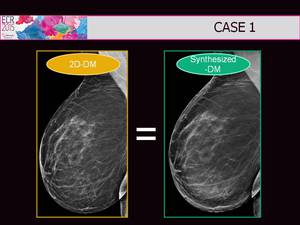
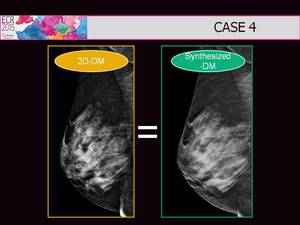
Fig. 8:
This is a 49 year-old woman with intermediate density in their breasts. We can...

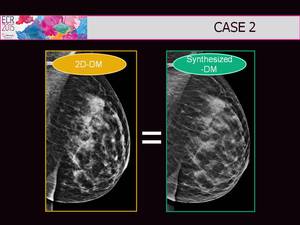
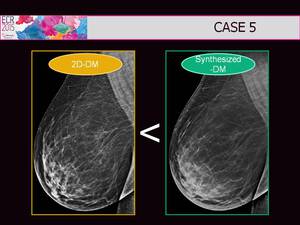
Fig. 9:
This 45 year-old woman has heterogeneous breast density. Slightly higher breast...

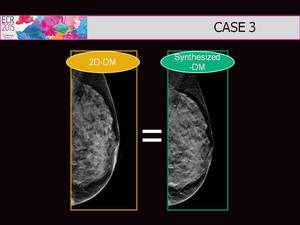
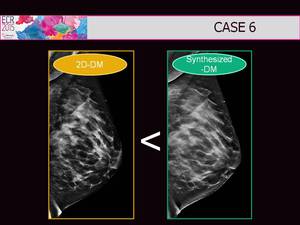
Fig. 10:
In this case we can see a large breast density but similar appearance is...

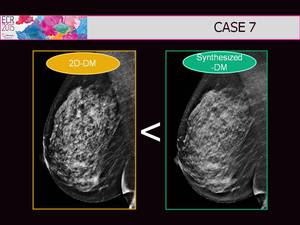
Fig. 11:
This 39 year-old woman has high breast density. However, similar appearence is...

Fig. 12:
This is a 42 year-old woman with intermediate density in their breasts. In this...

Fig. 13:
This other woman also has intermediate breast density. Look how higher breast...

Fig. 14:
This is a 45 year-old woman with heterogeneous breast density. Look at...

Fig. 15:
This is a particular woman with high breast density. Look at both techniques....