Normal lower leg anatomy:
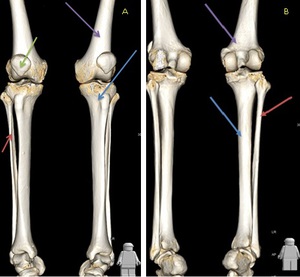
Fig. 1: 3D reconstruction demonstrating the normal osseous anatomy of the lower leg. Image A is anterior and B is posterior. Red arrow = fibula, Blue arrow = tibia, Purple arrow = femur, Green arrow = patella.
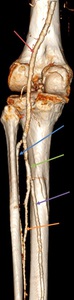
Fig. 2: 3D reconstruction of the main arterial anatomy of the lower leg. The superficial femoral artery continues as the popliteal artery (red arrow) as it exits the adductor hiatus (adductor magnus muscle opening). The popliteal artery courses through the popliteal fossa (spanning the intercondylar notch of the femur) and ends at the lower border of the popliteus muscle, where it branches into the anterior tibial artery (blue arrow) and the tibioperoneal trunk (green arrow) which branches into the posterior tibial artery (purple arrow) and the peroneal artery (orange arrow).
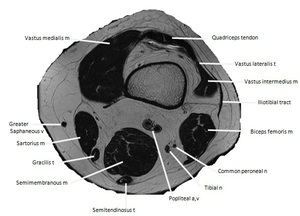
Fig. 3: Axial T2W MR image at the level of the distal femur. Key a = artery, n = nerve, m= muscle.
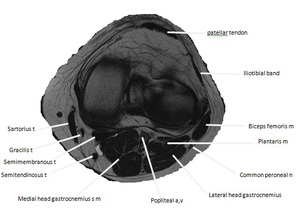
Fig. 4: Axial T2W MR image at the level of the tibial plateau. Key a = artery, n = nerve, m= muscle.
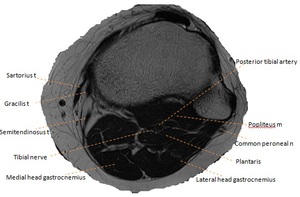
Fig. 5: Axial T2W MR image at the level of the proximal tibiofibular joint. Key a = artery, n = nerve, m= muscle.
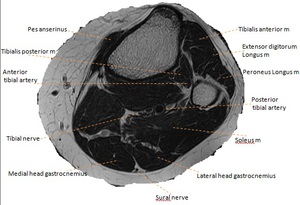
Fig. 6: Axial T2W MR image of the proximal lower leg. Key a = artery, n = nerve, m= muscle.
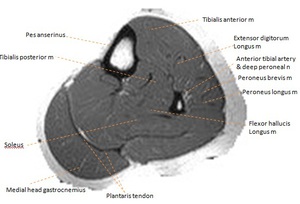
Fig. 7: Axial T2W MR image of the mid lower leg. Key a = artery, n = nerve, m= muscle.
The swollen painful leg:
Deep vein thrombosis (DVT):
- DVT is one of the most prevalent medical problems today.
- Lower-extremity DVT is the most common venous thrombosis,
with a prevalence of 1 case per 1000 population and the underlying source of 90% of acute pulmonary emboli [4].
Imaging features:
- Ultrasonography is the current first-line imaging examination.
Acute thrombosis (~ 14 days)
- Low echogenicity thrombus: May be virtually anechoic,
flow may be seen within recanalised thrombus.
- Venous distension: Recently thrombosed veins are distended and substantially larger than accompanying artery.
- Loss of compressibility: Thrombus is excluded if vein can be completely compressed.
- Free floating thrombus: Most recently formed clot.
Subacute thrombosis (~ 2 weeks to 6 months)
- Thrombus becomes more echogenic,
variable.
- Decrease thrombus and vein size: Retraction and lysis may reduce size of vein which may even be normal.
- Adherence of thrombus: Free floating thrombus becomes attached to vein wall.
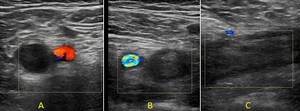
Fig. 8: Colour doppler ultrasound of the right (A) and left (B,C) common femoral veins (CFV). A = transverse view of the normal compressible right CFV with no filling defect. B = abnormal left CFV with echogenic thrombus in the CFV which is non-compressible and no colour flow. C - longitudinal view of the echogenic thrombus occupying the CFV in keeping with a deep vein thrombosis.
DVT mimics:
Musculoskeletal
- Fluid-filled sac with neck arising from interspace between gastrocnemius muscle and semimembranosus tendon.
-
Contains anechoic synovial fluid,
typically gelatinous in consistency.
-
Free fluid tracking adjacent to cyst indicates recent leakage.
-
Contralateral subclinical Baker cysts common.
-
Of note,
dual pathology of a DVT and Baker’s cyst has been reported in 3% of DVTs as the compressive effects of the cyst may predispose to the development of a DVT [5].
-
Follow medial belly of gastrocnemius proximally and locate interspace between medial gastrocnemius head and semimembranosus tendon.
Imaging features:
- T2WI
- Increased signal intensity mass: Gastrocnemius-semimembranosus bursa ± Hyperintense surrounding fluid = Leakage/rupture.
- Fluid-filled popliteal fossa mass.
- Anechoic ± fine internal echogenic speckles with posterior enhancement.
- Must see neck arising from medial gastrocnemius-semimembranosus tendon interspace to make diagnosis of Baker cyst.
- Characteristic "talk-bubble" configuration on transverse scans.
- Free fluid tracking adjacent to cyst indicates recent leakage.
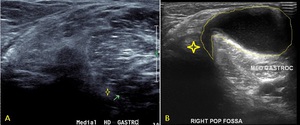
Fig. 9: Transverse ultrasound image of the right popliteal fossa demonstrating a Baker's cyst. Image A depicts a normal popliteal fossa with the medial head gastrocnemius marked by the green arrow and the adjacent semimembranous tendon (yellow star). Image B demonstrates a cystic structure arising between the medial head gastrocnemius and semimembranous tendon (yellow star) in a characteristic 'talk bubble' configuration (yellow outline).
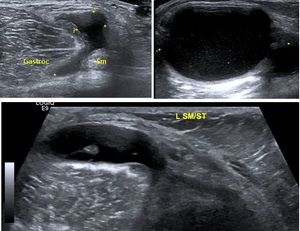
Fig. 10: Transverse ultrasound of the left popliteal fossa in three different patients demonstrating a fluid filled structure arising between the heads of the medial head gastrocnemius (yellow Gastroc) and the semimembranous tendon (Sm) in keeping with a Baker's cyst.
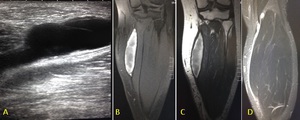
Fig. 11: A) Longitudinal ultrasound image, B) coronal T1 fat-saturated MR, C) coronal T2 MR and D) coronal STIR MR demonstrating a ruptured Baker's cyst. Fluid is seen tracking around the medial border of the medial head gastrocnemius.
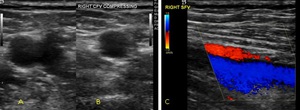
Fig. 12: Transverse ultrasound of a 25 year old male present with calf swelling. Deep vein thrombosis was excluded by ultrasound. Image A demonstrates a normal appearing right common femoral vein that is fully compressible (B) and demonstrates complete colour fill (C).
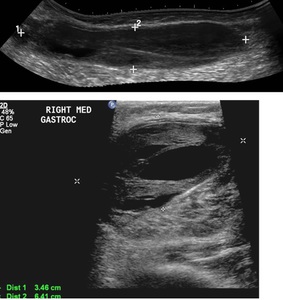
Fig. 13: Subsequent longitudinal panoramic (top image) and transverse (bottom image) scanning of the calf veins of the patient in Figure 12 demonstrates a heterogeneous solid/cystic area lying in the superficial fibres of the medial head gastrocnemius. Appearances are in keeping with a haematoma in a ruptured Baker's cyst.
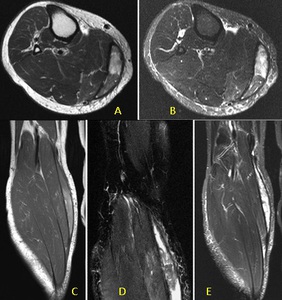
Fig. 14: Axial T1 (A) and STIR (B) MRI with coronal T1 (C) and STIR (D,E). The patient in Figure 12 underwent a subsequent MRI after clinical review which confirmed a thick walled mixed high and low signal intensity collection medial to the medial head gastrocnemius in keeping with a ruptured Baker's cyst with internal haematoma.
-
Tennis leg is caused by a rupture of the medial head of the gastrocnemius muscle,
usually at its distal musculotendinous junction region.
-
Tears in this muscle and its tendon are also included under the term ‘tennis leg’.
Imaging features:
-
High T2 signal fluid deep to medial gastrocnemius and superficial to the soleus.
-
Focal area of disruption of muscle continuity along the deep aspect of the medial head of the gastrocnemius,
with associated oedema of the muscle.
- Fluid deep to medial gastrocnemius and superficial to the soleus muscle most prominent at the level of the myotendinous junction.
- Disruption of the pinnate pattern of the distal medial gastrocnemius,
usually near the junction of the gastrocnemius,
the soleus,
and the plantaris (echogenic line running between the medial head gastrocnemius and soleus) muscles.
- Fluid tracking along the fascia.
- Adjacent haematoma.
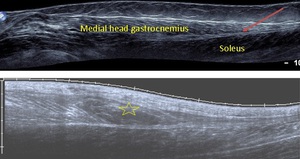
Fig. 15: Panoramic ultrasound images of the triceps surae. Top image demonstrates normal musculature with the medial head gastrocnemius seen superficial to the deeper soleus muscle. A thin double echogenic line between the two is the plantaris muscle (red arrow). The bottom image demonstrates an irregular hypoechoic area (yellow star) in the medial head gastrocnemius at the myotendinous junction represent muscle injury and haematoma in keeping with a tennis leg.
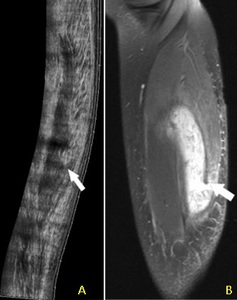
Fig. 16: A) longitudinal panoramic view of the medial gastrocnemius muscle demonstrating a muscle tear at its myotendinous junction (arrow) in keeping with a tennis leg. Corresponding STIR MR sagittal (B).
- Pes anserinus: "goose's foot" is the anatomic name given to the conjoined tendons of sartorius,
gracilis,
and semitendinosus as they pass around posteromedial aspect of proximal tibia.
- Pes anserinus bursa lies between the pes anserinus tendons and the more deeply located semimembranosus tendon at the level of the knee joint.
-
Repetitive motion causes friction between medial tibial condyle and pes anserine tendons and bursal inflammation usually seen in athletes or over-weight individuals.
Imaging features:
- Lobular fluid signal mass with well-defined thinly marginated borders between tendons of pes anserinus and proximal medial tibia.
- May be associated with tenosynovitis of tendons of pes.
- Well-defined anechoic fluid collection with increased through-transmission deep to pes anserinus tendons below medial knee joint.
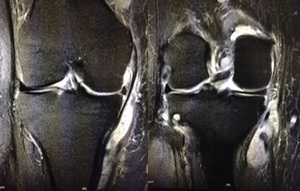
Fig. 17: Coronal STIR MR images of the knee demonstrates a fluid collection with surrounding oedema just deep to the pes anserinus and superficial to the medial collateral ligament in keeping with pes anserine bursitis.
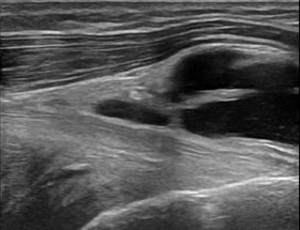
Fig. 18: Sagittal ultrasound image demonstrating septated fluid collection deep to the pes anserinus in keeping with pes anserine bursitis.
References: http://www.ultrasoundcases.info/ Dr. Taco Geertsma, Hospital Gelderse Vallei in Ede, The Netherlands
-
Focal protrusion of muscle or part of muscle through investing fascia.
-
Accentuated by muscle contraction or standing.
Imaging features:
- Focal defect in investing fascia +/- muscle protrusion.
-
Often see an accompanying vessel.
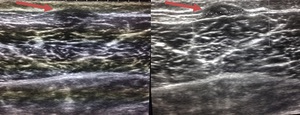
Fig. 19: Longitudinal ultrasound image of the anterior tibialias muscle demonstrating focal protrusion of muscle through a fascial defect (red arrow), which is more conspicuous on the second image with muscle contraction.
Vascular
- Popliteal artery is most common lower extremity location (70% of all peripheral aneurysms).
Aneurysm:
- Focal enlargement of vascular lumen due to intrinsic abnormality of arterial wall.
Pseudoaneurysm:
- Contained leakage of blood from artery into adjacent soft tissues due to disruption of arterial wall integrity.
- Persistent communication between artery and pseudoaneurysm cavity.
- Popliteal pseudoaneurysm is rare accounting for 0-3.5% of all popliteal aneurysms and usually a sequalae of penetrating trauma [7].
Imaging features:
-
Saccular or tortuous fusiform arterial enlargement.
-
Grayscale ultrasound: Fusiform or saccular arterial enlargement,
often with laminar thrombus within.
-
Colour Doppler: Pseudoaneurysm appears as rounded vascular structure of mixed biphasic signal described as yin-yang sign.
Identify communicating tract (neck) with underlying artery.
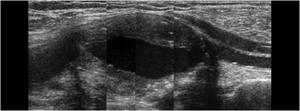
Fig. 20: Longitudinal panoramic view of the popliteal artery demonstrating a focal fusiform aneurysm with mural thrombus.
References: http://www.ultrasoundcases.info/ Dr. Taco Geertsma, Hospital Gelderse Vallei in Ede, The Netherlands
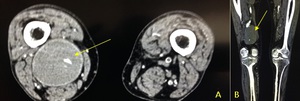
Fig. 21: CT axial (A) and coronal reformat (B) demonstrating a right popliteal aneurysm (yellow arrow) which is completely occluded with thrombus.
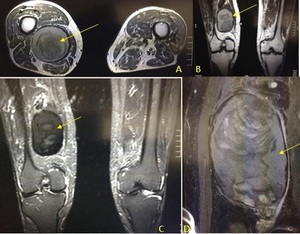
Fig. 22: MR axial (A) and coronal T1, coronal STIR (C) demonstrating the occluded right popliteal artery which contains hyperintense T1 mural thrombus with central low signal material in keeping with chronic blood products. Image (D) is a close up STIR coronal image demonstrate layers of differing blood products within the aneurysm.
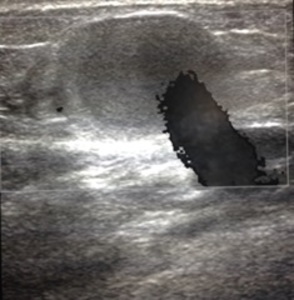
Fig. 23: Transverse ultrasound image of the popliteal artery demonstrating a jet of blood flowing into a thrombosed pseudoaneurysm secondary to trauma.
- Vascular malformations and haemangiomas [8]
- Haemangiomas are vascular tumours that are rarely apparent at birth,
grow rapidly during the first 6 months of life,
involute with time and do not necessarily infiltrate but can sometimes be destructive.
- Vascular malformation is a diffuse mass of dilated tortuous serpiginous vessels involving both arteries and veins.
In contrast to haemangiomas,
they are present at birth,
slow growing,
infiltrative,
and destructive.
- Almost all vascular malformations and nearly 40% of haemangiomas eventually require intervention.
Imaging findings:
Vascular malformation:
T1 weighted intensity (WI)
- Flow voids in high flow AVM.
- Predominantly iso- to low-signal intensity on T1WI.
T2WI
- High signal intensity on fat-suppressed T2WI : Bright "bag of worms".
- Low T2WI signal intensity foci may reflect phleboliths,
scars or haemosiderin deposition.
- Muscular high T2WI signal in presence of atrophy.
T2* GRE
- Susceptibility artifact indicates presence of haemosiderin from previous leakage/haemorrhage.
- Colour Doppler: Hypoechoic,
serpiginous compressible vascular mass.
- Performed for planning and performing embolization therapy.
- Dilatation of feeding arterial structures.
- Early venous opacification from arteriovenous shunting.
- Large draining efferent veins.
- Typically there are numerous feeding arterial structures.
- Often,
more feeding vessels become apparent after embolization of originally identified feeding arteries.
Haemangioma:
T1WI
- Isointense to hypointense relative to skeletal muscle.
- Foci of high signal corresponding to adipose tissue or slow-flow blood.
T2WI
- Hyperintense vascular regions.
T1WI with contrast:
- Vascular regions intensely enhance.
- Mass with heterogeneous echogenicity.
- Thrombosis may limit detection of blood flow.
- Acoustic shadowing from calcification.
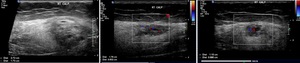
Fig. 24: Ultrasound images demonstrating a heterogenous intramuscular mass with cystic areas. There is hypervascularity on colour doppler imaging. Appearances are in keeping with a vascular lesion.
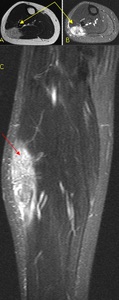
Fig. 25: Axial T2 (A) and STIR (B) and coronal STIR (C) MR images of the same patient as in figure 21 demonstrating a hyperintense T2 lesion (coloured arrows) in the lateral aspect of the soleus muscle with prominent 'feeder' arteries.
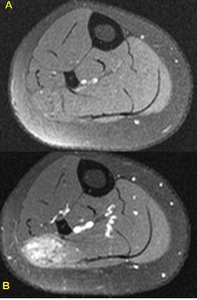
Fig. 26: Pre (A) and post (B) contrast axial T1 fat-saturated axial MR images of the lateral soleus intramuscular AVM which demonstrates intense enhancement after the administration of IV gadolinium.
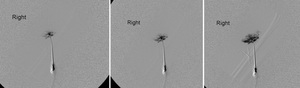
Fig. 27: Three sequential subtraction catheter angiography images of the vascular lesion of patient in Figure 21 demonstrating intense vascular enhancement. Subsequent successful embolisation was performed.
Neoplastic:
- Soft tissue sarcoma (STS)
- Malignant tumour that arises from connective (mesenchymal) tissue other than bone.
- Classified according to tissue type rather than anatomical origin.
- Grow centrifugally from single focus.
- Suspicious features include a soft tissue mass that is increasing in size,
has a size >5cm or is deep to the deep fascia,
whether or not it is painful.
Imaging features:
- Features depend on the type of tumour and may have,
internal cystic component,
myxoid tissue,
fat,
calcification or necrosis.
- Large heterogeneous hypoechoic mass.
- Usually located in deep (subfascial) tissues.
- Well-encapsulated.
± Myxoid tissue: Well-defined,
intra-tumoural anechoic or hypoechoic areas.
± Necrosis: Poorly-defined hypoechoic areas.
± Calcification: Discrete intra-tumoural echogenic foci with acoustic shadowing.
± Haemorrhage: Ill-defined intra-tumoural echogenic areas without acoustic shadowing.
- Usually hypervascular with disorganized vascular pattern on colour Doppler imaging.
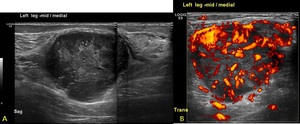
Fig. 28: Extended view sagittal ultrasound image of the lower leg demonstrating a large heterogenous soft tissue lesion with marked disorganised hypervascularity on power doppler imaging (B). Subsequent biopsy confirmed a malignant fibrous tumour.
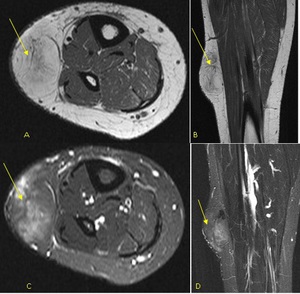
Fig. 29: Axial T1 (A), coronal T1 (B), STIR axial (C) and STIR coronal (D) MR images of the lower leg demonstrating a subcutaneous fat signal lesion with incomplete suppression. Internal thick septations give this fat lesion aggressive features. Excision biopsy confirmed a liposarcoma.
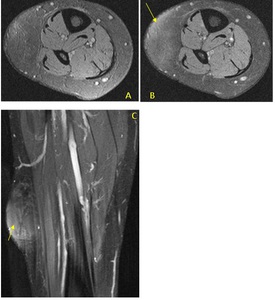
Fig. 30: Pre contrast T1 FS axial (A) and post contrast T1 FS axial (B) and coronal (C) MR images of the subcutaneous fatty lesion seen in figure 26 demonstrates heterogenous enhancement. Excision biopsy confirmed a liposarcoma.
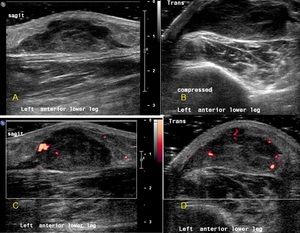
Fig. 31: Longitudinal ultrasound image (A) of a subcutaneous lesion that presented with a painful lower leg swelling. The heterogenous lesion was non-compressible and with neovascularisation (C,D). This aggressive looking lesion was histologically confirmed to be a myxofibrosarcoma.
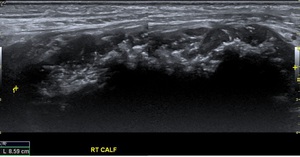
Fig. 32: Extended field of view longitudinal ultrasound of the right calf demonstrates a hypoechoic mass with intralesional calcification, located within the soleus muscle. Subsequent MR demonstrated in Figure 34.
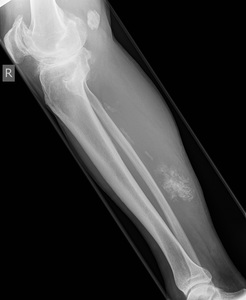
Fig. 33: Lateral radiograph of patient in Figure 32 demonstrating a calcific mass in the posterior aspect of the calf. Subsequent MR shown in Figure 33.
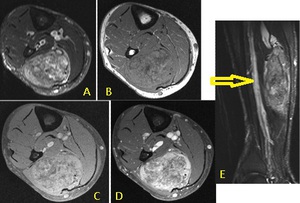
Fig. 34: Axial MR STIR (A), T1 (B), pre contrast T1 FS (C) and post contrast T1 FS (D) and STIR sagittal (E) of the patient in Figure 32 demonstrates a large enhancing solid soft tissue mass with central necrosis and diffuse calcification within the medial belly of the soleus muscle with an adjacent dilated deep vein (yellow arrow). Biopsy confirmed a chondrosarcoma.
Metastatses:
- smaller & less well-defined than a STS.
- greater peritumoural oedema.
- known primary tumour.
- disseminated disease.
Imaging features:
- Non-specific.
- Well-defined to infiltrative mass.
- Biopsy usually necessary for diagnosis if unkonkwn primary.
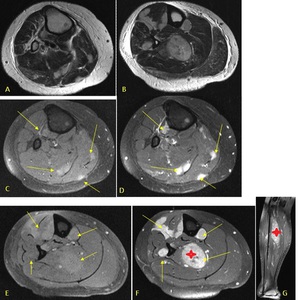
Fig. 35: Axial T2 images (A,B) demonstrating multiple hyperintense well-defined intramuscular lesions. Pre contrast T1 FS images (C,E) and corresponding post contrast T1 FS images demonstrate intensely enhancing masses throughout the lower leg (arrows) with a large lesion in the soleus muscle (star). The patient was known to have adenocarcinoma of the colon.
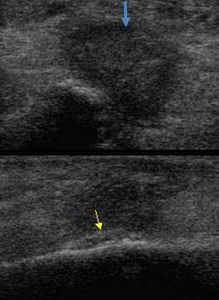
Fig. 36: Ultrasound images of the lower leg. The top image demonstrates an irregular hypoechoic solid lesion (blue arrow) just anterior to the fibula. The echogenic linear area along the fibula represents periosteal reaction (yellow arrow).
References: http://www.ultrasoundcases.info/ Dr. Taco Geertsma, Hospital Gelderse Vallei in Ede, The Netherlands
- Benign lipomatous tumour,
representing almost 50% of soft tissue masses.
- Should be similar to subcutaneous fat on any imaging modality.
- Characterised by location as:
- superficial to the deep fascia
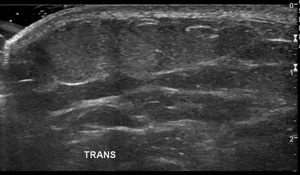
Fig. 37: Transverse image of the lower leg demonstrating a superficial subcutaneous fatty lesion which is isoechoic to the surrounding fat and is compressible. No aggressive imaging features demonstrated in keeping with a superficial lipoma.
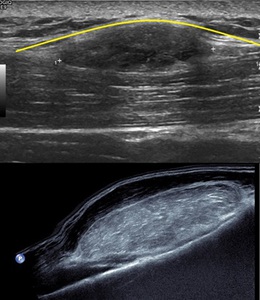
Fig. 38: Top image: Sagittal ultrasound image of the lower leg demonstrating a hypoechoic lesion which is deep to the deep fascia (yellow curvilinear line). Patient went on to have a subsequent MR and the lesion followed fat signal on all sequence in keeping with a deep lipoma. Bottom image: A large hyperechoic lesion deep to the muscle abutting the underlying fibula in keeping with a deep lipoma (proven on MR - images not shown).
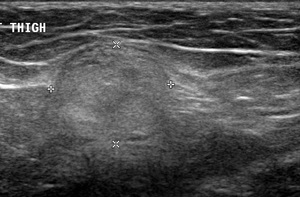
Fig. 39: Transverse ultrasound image of an intramusclar lesion which is echogenic typical for an intramuscular lipoma. Due to it's location an MRI should be performed to chracterise it.
Imaging features:
- Should follow subcutaneous fat signal on all modality.
Ultrasound:Variable echogencitiy [9]:
- 29% hyperechoic
- 22% isoechoic
- 29% hypoechoic
- 20% mixed echogenicity
- Compressible and without posterior acoustic enhancement.
- No flow on colour Doppler sonography.
Infective:
- Acute infection of the dermis and subcutaneous tissues.
- Predisposing factors:
- Poor health,
venous/lymphatic stasis,
skin laceration/ulceration,
obesity,
immunosuppression (including diabetes),
infection elsewhere
Imaging features:
Cannot differentiate septic from aseptic fluid on imaging
T1WI
-
Swelling,
hypointensity & increased reticulation of subcutaneous fat
T2WI FS
- Diffuse hyperintensity of subcutaneous tissues
- Patchy oedema of adjacent tissues
- Diffuse increase in the thickening and echogenicity of the subcutaneous tissue.
- Thickened interlobular septa
- Accumulation of fluid in the subcutaneous tissue,
interdigitating fat lobules giving a "cobble-stone appearance".
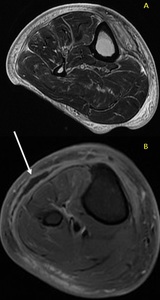
Fig. 40: Axial T2 weighted MR (A) demonstrating increased T2 signal throughout the subcutaneous fat and perifascial oedema, A focal rim enhancing collection (white arrow) is seen in the post contrast T1 FS axial image (B) represent a subcutaneous abscess. No air seen to suggest necrotising fasciitis.
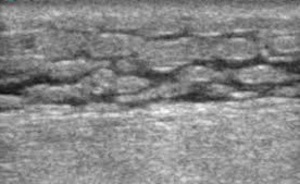
Fig. 41: Ultrasound image of the subcutaneous fat demonstrating the 'cobble-appearance' of oedematous fat. Fluid is interdigitating between the fat globules. Septic versus aseptic fluid cannot be distinguished on imaging.
CHALLANGE:
What is the diagnosis for the patient's lower leg swelling?
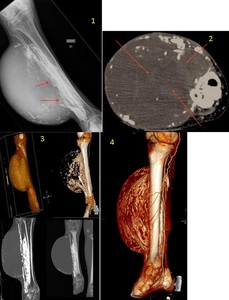
Fig. 42: 1. Plain film of the lower leg with erosion of the fibula with a large soft tissue lesion.
2. Axial CT with peripherally calcified soft tissue mass with intralesional high density (arrows).
3. 3D reconstructions.
4. 3D reconstruction demonstrating numerous collaterals around the soft tissue lesion.
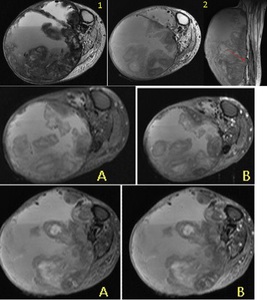
Fig. 43: 1. Axial T2 MR with fluid-fluid levels and frond-like low signal areas.
2. Axial T1 with hyper and hypointensities within the lesion. Fibula erosion demonstrated (red arrow).
A) pre contrast images.
B) post contrast images.
Answer in the reference section [10].
