To date,
SEL has been demonstrated to be a useful method for the assessment of tissue elasticity in various clinical fields,
such as breast,
thyroid,
liver and musculoskeletal imaging.
Despite its variability and its availability on recent US machines,
both strain and shear wave elastography has been widely used and seem to be a promising tool for radiologists in the next years.
ELASTICITY: BASICS PRINCIPLES
The elasticity of a material represents its tendency to resume its original size and shape after being subjected to a deforming force or stress.
Fluids resist a change in volume,
but not in shape: they have only ‘volume elasticity’; solids instead resist changes in volume and shape: they present rigidity or ‘shear elasticity’,
as well as volume elasticity; viscoelastic fluids also exhibit elasticity in certain conditions.
Because the elasticity of a material is described in terms of a stress-strain relation,
it is essential that the terms stress and strain be defined: the relative deformtion in volume or shape,
is produced by a force per unit area (called ‘stress’),
and is referred to as the ‘strain’.
For a homogeneous isotropic solid,
the ratio of stress/strain is a constant,
called the ‘modulus of elasticity’.
A modulus (usually expressed in units of Pa) measures the amount of force per unit area (stress) needed to achieve a given amount of deformation.
A higher modulus typically indicates that the material is harder to deform.
Three moduli are commonly used to define elasticity:
- Young’s modulus (E),
represents longitudinal elasticity;
- Shear or torsion modulus (G) represents transverse elasticity;
- Bulk or volume modulus (K) represents volume elasticity.
Solids can support mechanical waves in four principal modes: in longitudinal (or compressional) waves,
the particles move in the direction of propagation,
whereas in transverse (or shear) waves,
they move in the direction normal to the direction of propagation.
The shear modulus describes the response to shear forces,
Young's modulus describes the response to linear stress (tensile stress) and bulk modulus represents the response (in all directions) to uniform compression; it is usual for values of shear and Young’s modulus to be reported in the studies regarding the investigation of elastic properties of tissues by mean of ultrasound.
The other two principal wave modes are hardly relevant to propagation in biological soft tissues and so they are not given further consideration here.
MODALITIES
There are several elastographic techniques depending on the difference in the stress application and the method used to detect tissue displacement and build the image.
Two main types of SEL have become established in clinical practice,
in particular for soft-tissue evaluation:
Strain elastography
It is also described as ‘quasi-static elastography’,
‘compression elastography’ and ‘real-time elastography’; the stress is applied by repeated manual compression of the transducer,
and the amount of tissue deformation (strain) relative to the surrounding normal tissue is measured,
usually with a tracking algorithm working on the radio-frequency data.
The resulting data can then be used to form an image that is coded in colour or grey-scale to show the pattern of strain,
which is inversely related to tissue stiffness and can be assessed subjectively ( Fig. 1 a).
These are qualitative data,
however regions of interest (ROIs) can be positioned over target areas in the screen in order to obtain semi-quantitative analysis ( Fig. 1 b).
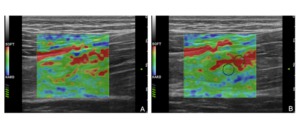
Fig. 1: Strain Elastography. A) qualitative analysis: the modulus of elasticity of the soft tissue scanned in the B-mode image is represented by a superimposed color-coded map in which (in this case) the lower values are depicted in red and the higher ones in blue;
B) it is shown the possibility to perform a also semi-quantitative analysis of the strain elastogram with placement of two ROIs in order to take definite measurements of the Young’ s modulus of elasticity of the targeted tissue..
The green-coloured spring-shaped figure shown in the left bottomof both the elastograms indicates that the pressure the operator performed with the transducer was appropriate to produce an adeguate stress to get the elastogram.
References: Department of Radiology, OEIGe, Genova, Italy 2014
Shear wave elastography
Shear wave imaging is a very potential technique for the non-invasive quantification of tissue stiffness.
Shear waves in the body can be induced by various methods,
including physiological motion,
external mechanical excitation,
or acoustic radiation force (by a focused ultrasound beam).
Shear waves are transverse,
they are rapidly attenuated by tissue,
they travel much more slowly (between 1 and 10 m/s) and they are not supported by liquids of low viscosity.
Using a real-time imaging modality such as ultrasound (but also magnetic resonance),
the underlying tissue stiffness can be estimated measuring the produced shear waves speeds: Their speed is commonly expressed in meters per second (m/s); it is closely related to the modulus of elasticity of the tissue and there is a simplified formula for converting,
with some assumptions (based on the conventional tissues mechanical properties),
between the shear wave speed and the elastic modulus of the tissue to locally quantify its stiffness in kilopascals (kPa).
In contrast to strain elastography,
this technique allows for the performance of quantitative analysis of the tissue stiffness.
There are some variations of this method in clinical practice,
depending on the difference in the modality of stress application:
- Transient Elastography (TE): is a system developed and commonly used for liver fibrosis assessment,
in which a mechanical piston within a ultrasound transducer is used to apply a push to the skin over an intercostal space.
The speed of the produced shear waves into the liver,
along the direction of the ultrasound beam,
is measured in a way similar to M-mode.
- Acoustic Radiation Force Imaging (ARFI): in this technique a ‘pushing’ focused ultrasound beam (with intensity below the thresold for bioeffects) is used to induce tiny displacements in soft tissue along its direction and generate orthogonal shear waves that propagate sideways in tissue.
The shear waves speed or amplitude is detected by conventional ultrasound using tracking algorithms and is used to quantify the underlying tissue stiffness.
Shear wave speed measurement could be made by a single small measurement box positioned by the operator within the tissue adjacent to the pushing beam ( Fig. 2 ),
and/or could be extended to sequential multiple pushing and measurement points in order to construct a colour-coded map of the shear wave speed,
which is also quantitative with positionable ROIs ( Fig. 3 ).
Resuming,
ARFI images represent the spatial distribution of tissue stiffness.
- Supersonic Shear Imaging (SSI): is a similar system which uses multiple acoustic radiation force impulses focused at different depths to create an extended cylindrical wavefront.
These excitations are applied supersonically so that the shear waves generated from different depths constructively interfere adding each others and dedicated ultrasound transducers could detect and measure them.
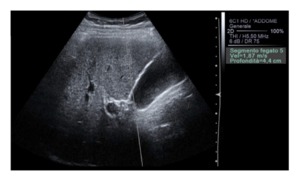
Fig. 2: Shear Wave Imaging. In this figure one of the applications of the shear waves elastography is shown: shear wave speed quantification is obtained by a single small measurement box positioned by the operator within the tissue (fifth segment of the liver in this case) along the direction of the pushing beam. Data regarding liver segment, depht of the box placement and shear waves speed expressed in meters per second are represented right to the B-mode image.
References: Department of radiology, OEIGe, Genova, Italy 2014
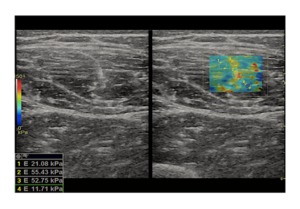
Fig. 3: Shear wave Elastography. The figure shows a soft-tissue (a rectus femoris muscle in this case) shear wave elastography: after the generation of the ‘pushing’ beam by the transducer, the values of the shear modulus in the targeted area are represented by mean of a color-coded map set as represented by the coloured bar on the left of the screen. It is possible to get also a quantitative analysis of the investigated tissue by placing some ROIs (with modifiable dimensions) over the map and get the corrensponding value at the left bottom angle of the screen. Note on the right elastographic map the stiffer areas in the center of the map corrensponding to the central rectus femoris aponeurosis.
References: Department of radiology, OEIGe, Genova, Italy 2014

 qualitative analysis: the modulus of elasticity of the soft tissue scanned in the B-mode image is represented by a superimposed color-coded map in which (in this case) the lower values are depicted in red and the higher ones in blue;
B) it is shown the possibility to perform a also semi-quantitative analysis of the strain elastogram with placement of two ROIs in order to take definite measurements of the Young’ s modulus of elasticity of the targeted tissue..
The green-coloured spring-shaped figure shown in the left bottomof both the elastograms indicates that the pressure the operator performed with the transducer was appropriate to produce an adeguate stress to get the elastogram. References: Department of Radiology, OEIGe, Genova, Italy 2014")
 along the direction of the pushing beam. Data regarding liver segment, depht of the box placement and shear waves speed expressed in meters per second are represented right to the B-mode image. References: Department of radiology, OEIGe, Genova, Italy 2014")
 shear wave elastography: after the generation of the ‘pushing’ beam by the transducer, the values of the shear modulus in the targeted area are represented by mean of a color-coded map set as represented by the coloured bar on the left of the screen. It is possible to get also a quantitative analysis of the investigated tissue by placing some ROIs (with modifiable dimensions) over the map and get the corrensponding value at the left bottom angle of the screen. Note on the right elastographic map the stiffer areas in the center of the map corrensponding to the central rectus femoris aponeurosis. References: Department of radiology, OEIGe, Genova, Italy 2014")