Twenty-four healthy volunteers and thirteen patients with clinical sign of lower limb tendinous and/or muscular pathology were consequently evaluated with conventional sonography and SEL in order to have useful representation of the elastic modulus of such structures in different conditions and get a useful depiction of SEL patterns.
As it follows,
a series of explanatory images regarding our preliminary results has been provided to illustrate SEL applications.
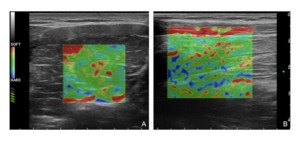
Fig. 4: Strain Elastography of normal skeletal muscle. A) transverse scan B) longitudinal scan. Both images show a homogeneous elastographic map of the skeletal muscle with the green color representing the muscular fibres which present an intermediate elastic module relative to the surrounding tissue; blue and red coloured spots may represent both artifacts and connective and/or fat tissue between the fibres; note the fat subcutaneous tissue on the top of the elastogram in B which present homogeneous softer appearance in comparison to the muscular tissue below.
References: Department of radiology, OEIGe, Genova, Italy 2014
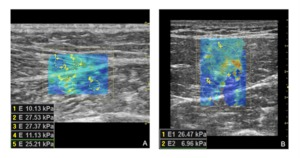
Fig. 5: Shear wave elastography of normal skeletal muscle. A) longitudinal/oblique scan at the level of the gastrocnemius medialis-soleus aponeurosis; B) transverse scan of the rectus femoris muscle. Note in B the stiffer areas in the center of the map corrensponding to the central rectus femoris aponeurosis. In our study the resulted mean values of elasticity of normal skeletal muscle examined at rest ranged 22±14 kPa±SD on longitudinal scans and 18±13 kPa±SD on transverse scans.
References: Department of radiology, OEIGe, Genova, Italy 2014
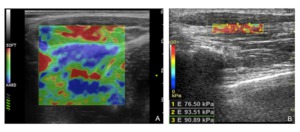
Fig. 6: Elastography of the normal tendon. A) Strain elastography of the proximal tendon of the rectus femoris muscle showing an homogeneous blue patter which reflects the stiffer tissue composition in relation to the surrounding muscles (red and green). B) Shear wave elastography of the flexor longus tendon of the first finger depicts tendinous structure with ‘stiffer colors’: quntitative analysis performed by the placement of three ROIs provided a mean value of elasticity of 87 kPa. In our study the resulted mean values of elasticity of normal tendons (examined at rest and along their long axis) ranged 103±75 kPa±SD.
References: Department of radiology, OEIGe, Genova, Italy 2014
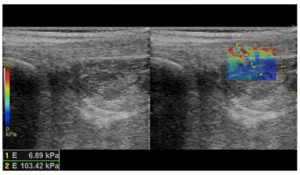
Fig. 7: Shear wave elastography of the calcaneal tendon. The image shows two ROIs placed over two different homogeneous tissue: ROI 1 over an area corresponding to Kager’s fat tissue, ROI 2 over an area corresponding to part of the Achille’s tendon fibres. Both the elastographic map and the quantitative values well reflect the difference in elastic shear modulus between these two tissue, with good spatial resolution.
References: Department of radiology, OEIGe, Genova, Italy 2014
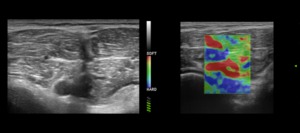
Fig. 8: Muscle tear. The image on the left is a B-mode transverse scan over the dorsal aspect of the calf showing a deep tear of the soleus fibres. The image on the right is the corresponding strain elastographic analysis performed on the lesioned area: there is a clear depiction of the injuried area which is represented as softer tissue (red coloured) in relation to the surrounding normal one.
References: Department of radiology, OEIGe, Genova, Italy 2014
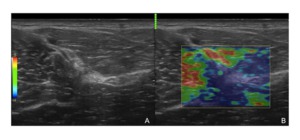
Fig. 9: Scar tissue - strain elastography. A) This figure illustrates the identification of an area of scar tissue in the deep hamstrings by mean of the B-mode evaluation; B) the strain elastographic analysis conducted over the same area shows the relative higher stiffness of the whole area (which could suggest a limitation in the biomechanical properties of the muscle fibres at that site).
References: Department of radiology, OEIGe, Genova, Italy 2014
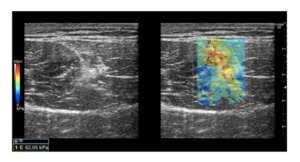
Fig. 10: Scar tissue - shear wave elastography. Shear wave elastography conducted on a transverse scan of the rectus femoris muscle. The B-mode image on the left shows a hyperechoic area around the central aponeurosis; the image on the right shows the elastographic map superimposed over the injuried area which well shows the stiffer structure of the scar tissue, also confirmed by the quantitative analysis performed by the placement of the ROI.
References: Department of radiology, OEIGe, Genova, Italy 2014
TECHNICAL CONSIDERATIONS
Sonoelastography has been improved a lot for recent years together with its use in the clinical practice,
scientific research and ultrasound machines developments.
Despite these significant implementations,
some technical considerations have to be made in order to fully understand the actual potential of this technique and to make the sonoelastographic examinations as accurate as possible.
In strain elastography data acquisition and interpretation of elasticity images are largely dependent on the operators’ experience and skills.
SEL softwares derive elastograms which usually depend on the changing probe pressure experienced during freehand scanning and on the individual capability of images interpretation: consequently possible significant intra- and inter-observer variability has to be taken in consideration.
Further,
this technique provides only qualitative and/or semi-quantitative analysis with elasticity data resulting from the relative stiffness of the targeted region and the remaining tissue area.
Hence,
this technical feature may significantly influence the clinical use of strain elastography in terms of reproducibility and accuracy.
In contrast,
the quantitative nature of shear wave elastography is an advantage and seems to let this technique to be more reproducible; the fact that the system displaces the tissue could improve consistency since the examinator does not need to move the transducer.
The localised nature of the applied force should also improve the relationship between displacement and elasticity compared with applying the force at the surface,
as well as improve contrast and spatial resolution.
Despite the overall promising features of shear wave sonoelastography,
in particular if compared with those of the strain elastography,
some limitations have to be mentioned.
Shear wave speed measurements using radiation force produced by a focused ultrasound beam can be dependent on transducer geometry,
focusing depth,
lateral tracking range and frequency of the shear wave used for imaging.
Further,
the shear wave speed in tissue is dependent on the shear modulus and its density,
usually calculated by making some conventional assumptions which not always reflect the actual charatcteristics of the investigated tissue.
In normal skeletal muscle,
fibres are arranged in parallel fasciculi with different orientation and stiffness results from active tension produced by muscle contraction and passive tension produced largely by connective tissue.
Due to this geometric structure,
it does not conform to the isotropic mechanical behavior usually assumed for tissue and its mechanical properties make shear wave sonoelastographic 2D-imaging a harder challenge in skeletal muscle.
As the shear wave speed in muscle is anisotropic,
it depends on the direction of propagation with respect to the fiber orientation but the muscle fiber orientation is not usually precisely known,
so the usual assumption of isotropy used in shear wave speed based shear modulus reconstruction techniques does not always apply properly.
In an ultrasound study where the transducer is not aligned with the muscle fibers,
it may be more accurate to report only shear wave speed,
rather than converting to shear modulus.
As skeletal muscle may be considered transversely isotropic the best way to minimize the effect of anisotropy on measurements in muscle is by orienting the transducer imaging plane with respect to the fiber or in a plane of symmetry of the muscle: the drawback is that the actual fiber orientation relative to the imaging plane is estimated by manual inspection of the operator in B-mode.
This approach suggests that measurements can be made relatively independent of the push angle but it is very important to remember that less accurate shear wave speed measurements can occur for oblique tilt angles of the transducer in respect to fibres orientation.
Resuming,
SEL offers clinicians an advanced level of diagnostic information for the evaluation of tissue stiffness,
but measurement bias have to be considered in terms of clinical relevance and therefore require careful monitoring and/or correction.

 transverse scan B) longitudinal scan. Both images show a homogeneous elastographic map of the skeletal muscle with the green color representing the muscular fibres which present an intermediate elastic module relative to the surrounding tissue; blue and red coloured spots may represent both artifacts and connective and/or fat tissue between the fibres; note the fat subcutaneous tissue on the top of the elastogram in B which present homogeneous softer appearance in comparison to the muscular tissue below. References: Department of radiology, OEIGe, Genova, Italy 2014")
 Strain elastography of the proximal tendon of the rectus femoris muscle showing an homogeneous blue patter which reflects the stiffer tissue composition in relation to the surrounding muscles (red and green). B) Shear wave elastography of the flexor longus tendon of the first finger depicts tendinous structure with ‘stiffer colors’: quntitative analysis performed by the placement of three ROIs provided a mean value of elasticity of 87 kPa. In our study the resulted mean values of elasticity of normal tendons (examined at rest and along their long axis) ranged 103±75 kPa±SD. References: Department of radiology, OEIGe, Genova, Italy 2014")

 in relation to the surrounding normal one. References: Department of radiology, OEIGe, Genova, Italy 2014")

 This figure illustrates the identification of an area of scar tissue in the deep hamstrings by mean of the B-mode evaluation; B) the strain elastographic analysis conducted over the same area shows the relative higher stiffness of the whole area (which could suggest a limitation in the biomechanical properties of the muscle fibres at that site). References: Department of radiology, OEIGe, Genova, Italy 2014")
 longitudinal/oblique scan at the level of the gastrocnemius medialis-soleus aponeurosis; B) transverse scan of the rectus femoris muscle. Note in B the stiffer areas in the center of the map corrensponding to the central rectus femoris aponeurosis. In our study the resulted mean values of elasticity of normal skeletal muscle examined at rest ranged 22±14 kPa±SD on longitudinal scans and 18±13 kPa±SD on transverse scans.
References: Department of radiology, OEIGe, Genova, Italy 2014")