Neutral radiography
Spondylolysis refers to the radiolucent defect in the pars interarticularis.
The width of the gap depends on the degree of spondylolisthesis (Fig. 3).
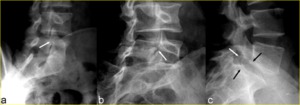
Fig. 3: Unilateral spondylolysis of L5 in a 16-year-old boy with complaint of back pain. a) Right oblique radiograph of the lumbosacral spine shows narrow pars defect which appears as a radiolucent line around the “dog’s neck” (arrow). The edges appear jagged, and without much sclerosis. b, c) 37-year-old woman with chronic non-union of the pars of the L5 vertebra. Right oblique radiograph (b) shows spondylolysis of L5 (white arrow). Note gap as well as the smooth and rounded edges of the defect. Lateral view (c) shows L5-S1 spondylolisthesis (black arrows) and the wide osseous gap of the L5 pars (white arrow).
References: Leone A et al. (2011) Lumbar spondylolysis: a review. Skeletal Radiol 40:683–700.
Indirect signs of spondylolysis on the anteroposterior view include lateral deviation of the spinous process (which is difficult to determine) and sclerosis of the contralateral pedicle (Fig. 4).
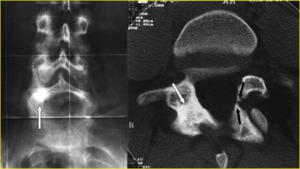
Fig. 4: A 25-year-old man with left spondylolysis and contralateral reactive sclerosis of the L5 neural arch. a) Anteroposterior radiograph shows the sclerosis projectively super imposed on the right pedicle of L5 (arrow). b) Reverse-angle transverse oblique CT scan through the pars of L5 shows left spondylolysis (black arrows) and better defines the extension of the reactive sclerosis of the contralateral neural arch (white arrow).
References: Leone A et al. (2011) Lumbar spondylolysis: a review. Skeletal Radiol 40:683–700.
Functional radiography
In symptomatic spondylolisthesis,
mobility at the pars defect is determined on functional flexion–extension radiography.
The type of sagittal rotation (variation of the angle between vertebral endplates adjacent to the disk) is more interesting than sagittal translation (defined by a slip of one vertebra relative to the vertebra below) because it defines the type of spondylolisthesis as axial (opposed vertebral endplates remain parallel to each other) in extension or in flexion.
Most spondylolisthesis occur in flexion,
but axial or extension spondylolisthesis more commonly results in nerve root compression.
Values of 10° for sagittal rotation and 4 mm for sagittal translation are typically used to infer instability [9] (Fig. 5).
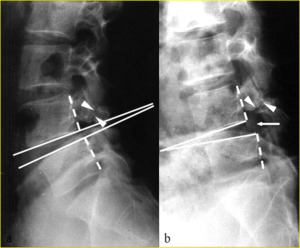
Fig. 5: Functional lateral radiographs of lumbar spine in 19-year-old man show L4-5 intervertebral instability with 18° sagittal rotation between a) extension and b) flexion. Sagittal rotation, which corresponds to the variation of the angle between vertebral endplates adjacent to the disk, is measured by drawing perpendicular lines (solid white lines) to the vertebral bodies’ posterior walls (dotted white lines). If the apex of the angle is dorsal to vertebral body, the angle is positive; if it is ventral, the angle is negative.
Thus, in this case, the angle goes from negative to positive during flexion-extension. The sagittal rotation is the sum of the angles measured in flexion and extension. Note the narrow pars defects with irregular edges (arrowheads in a and b) and the minimal extension spondylolisthesis evident in (a) which becomes a more evident flexion spondylolisthesis in (b) (arrow).
References: Leone A et al. (2011) Lumbar spondylolysis: a review. Skeletal Radiol 40:683–700.
CT
CT is the best procedure for clearly visualizing spondylolysis when a pars fracture is present.
Advances in CT technology have led to the current generation of multidetector CT scanners that boast faster acquisition,
increased anatomical coverage,
higher spatial resolution,
and isotropic data acquisition (Fig. 6).
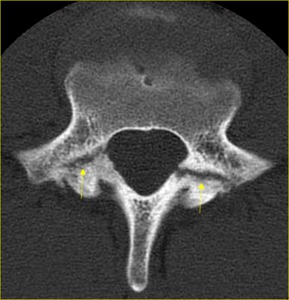
Fig. 6: Axial CT scan clearly shows pars defects of L5 vertebra (arrows) in a 16-year-old boy suffering from low back pain.
References: Institute of Radiology, Catholic University, School of Medicine, Rome/Italy.
On axial CT scans,
pars defects could simulate the adjacent facet joints because both the joints and the defects are oriented in similar planes and are separated by only a small distance (Fig. 7).
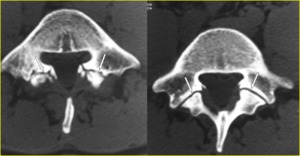
Fig. 7: Bilateral L5 spondylolysis in a 16-year-old boy suffering from low back pain. a, b) Contiguous transverse CT images through the inferior portion of the L5 pedicles show the pars defects (arrows in a) which must not be mistaken for the facet joints, which are visible on a scan immediately below (arrows in b). A pars defect is more irregular with sinuous contours and irregular sclerotic margins. Note the widened sagittal diameter of the spinal canal.
References: Leone A et al. (2011) Lumbar spondylolysis: a review. Skeletal Radiol 40:683–700.
Sagittal reformatted images show to better advantage the difference between a pars defect and the facet joints (Fig. 8).
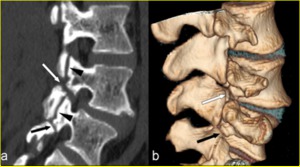
Fig. 8: Chronic non-union of pars fractures in an 18-year-old elite soccer player. a) Sagittal MPR CT image to the right of the midline and b) volume-rendered CT image clearly show complete fracture clefts with wide, smooth and rounded margins involving the right L4 (white arrow in a and b), and L5 (black arrow in a and b) pars interarticularis. The difference between pars defects and the facet joints is clearly demonstrated on the sagittal reformatted image (arrowheads in a). It is noteworthy that this patient also had left chronic non-union of pars defect at the L4 level.
References: Leone A et al. (2011) Lumbar spondylolysis: a review. Skeletal Radiol 40:683–700.
CT is the imaging modality of choice for clearly determining whether bony elements (Gill’s nodules) are present in or adjacent to the fibrous or fibrocartilaginous tissue filling the pars defect (Fig. 9).
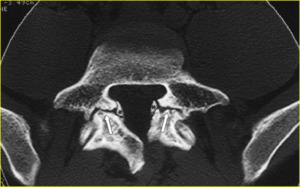
Fig. 9: Bilateral spondylolysis of L5 in a 33-year-old man with low back pain. Transverse CT image shows pars defects of the L5 vertebra with wide, well corticated margins (arrows). The associated bony elements (*), which are represented by ossification of the ligamenta flava, narrow the transverse diameter of the spinal canal. The sagittal diameter of the spinal canal is widened.
References: Leone A et al. (2011) Lumbar spondylolysis: a review. Skeletal Radiol 40:683–700.
Radionuclide imaging
The potential for false-positive and false negative results as well as the use of ionizing radiation render single-photon emission computed tomography (SPECT) an unacceptable screening investigation for spondylolysis in young patients.
SPECT imaging may be abandoned except where MR imaging is contraindicated [9].
Magnetic Resonance (MR) imaging
Pars defect appears as an interruption of the cortex and marrow through the pars.
It’s best seen on T1-weighted images,
which allow the greatest contrast between hyperintense bone marrow and the signal void of the bony cortex (Fig. 10).
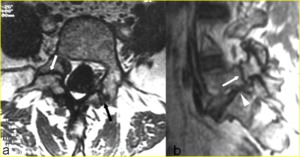
Fig. 10: Bilateral spondylolysis of L5 in a 54-year-old woman suffering from sciatica. a) Axial T1-weighted image through the L5 vertebral body shows the areas of decreased marrow signal (arrows) corresponding to sclerosis and the widened sagittal diameter of the spinal canal. b) Right parasagittal T1-weighted image confirms the spondylolysis (arrow) and shows encroachment of the neural foramen and entrapment of the L5 nerve root with near complete loss of the high-intensity foraminal perineural fat signal (arrowhead).
References: Leone A et al. (2011) Lumbar spondylolysis: a review. Skeletal Radiol 40:683–700.
If there is also a gap at the site of the lysis,
the signal intensity of the tissue filling the defect is variable.
At times,
an abnormally high signal within the defect may be observed on long TR images (Fig. 11).
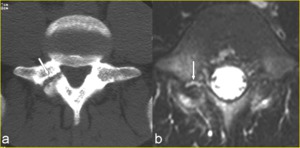
Fig. 11: A 15-year-old boy presenting with right spondylolysis of the L5 vertebra. a) Transverse CT image through the pedicles of L5 clearly demonstrates complete pars defects (arrow). b) Corresponding fat saturated transverse T2-weighted image shows an abnormally high signal within the defect consistent with inflammatory tissue or fluid (arrow).
References: Leone A et al. (2011) Lumbar spondylolysis: a review. Skeletal Radiol 40:683–700.
MR imaging vs CT
MR imaging is limited in demonstrating the radicular stretching linked to the displacement of the slipping vertebra.
MR imaging,
however,
can show other possible causes of nerve root compression,
such as hypertrophic tissue filling the pars defect,
disk herniation,
and neural canal stenosis.
The tissue that is found in the anteroinferior aspect of the defect in the foramen toward the canal is clearly demonstrated on sagittal T1- and T2-weighted images [10] (Fig. 12).
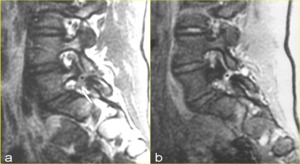
Fig. 12: Spondylolysis with spondylolisthesis in a 27-year-old man with pain radiating to the left lower extremity. a) Sagittal T1-weighted MR image to the left of midline and b) corresponding gradient echo MR image show, respectively, intermediate signal intensity and increased signal intensity from the tissue that fills the pars defect (* in a and b) and extends into the neural canal with impingement of L5 nerve root (arrow in a), which is still surrounded by high-intensity fat signal. Note the interruption of the cortical margin and the normal marrow signal indicating a grade 4 spondylolysis.
References: Leone A et al. (2011) Lumbar spondylolysis: a review. Skeletal Radiol 40:683–700.
On CT,
the density of the nerve root is similar to the density of the tissue filling the defect and of the disk material and their interrelationships are shown only if the epidural fat surrounds the nerve root (Fig. 13).
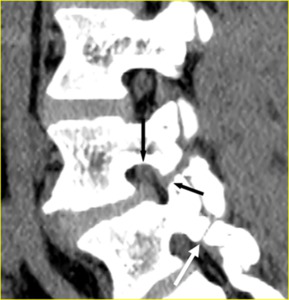
Fig. 13: Chronic non-united pars fractures. Sagittally multiplanar reformatted CT image to the right of midline. Note the similar density of the right L4 nerve root (black arrow), tissue filling the defect (small black arrow) and disk material. Right L5 spondylolysis is also evident (white arrow).
References: Leone A et al. (2011) Lumbar spondylolysis: a review. Skeletal Radiol 40:683–700.
MR imaging grading system
A reliable classification system for MR imaging in the diagnosis and grading of lumbar spondylolysis has been proposed [11] (Table 1).
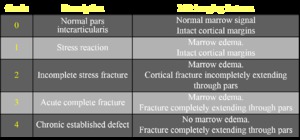
Table 1: Magnetic resonance imaging grading system for stress injuries to the lumbar pars interarticularis.
References: Leone A et al. (2011) Lumbar spondylolysis: a review. Skeletal Radiol 40:683–700.
The reported MR imaging classification system utilizes both the morphological information of MR imaging combined with the presence or absence of marrow edema on fluid-sensitive sequences.
This distinguishes between stress reaction and active or inactive spondylolysis.
MR imaging is an accurate modality for demonstrating the normal pars interarticularis (grade 0),
acute complete defects (grade 3),
and chronic established defects (grade 4).
Early spondylolysis (grade 1) has been described as a stress reaction evidenced by increased signal intensity in the pars on STIR or fat-saturated T2- images,
indicating marrow edema [11,12].
This appearance is considered to represent a metabolically active stress fracture (Fig. 14).
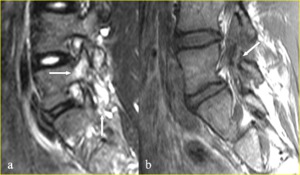
Fig. 14: A 16-year-old gymnast complaining of back pain, whose MR imaging showed pars bone marrow edema and despite advice continued training. a) Right parasagittal fat saturated T2-weighted MR image shows a peri-isthmic area of marrow edema at the L5 level with no evidence of pars defect (grade 1 spondylolysis) (arrows). b) Sagittal T1-weighted MR image performed six months later clearly depicts the intermediate signal intensity of the complete fracture cleft (arrow).
References: Leone A et al. (2011) Lumbar spondylolysis: a review. Skeletal Radiol 40:683–700.
Recognition of incomplete (grade 2) stress fractures could remain the challenge for MR imaging (Fig. 15).
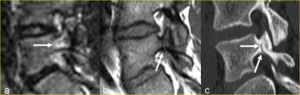
Fig. 15: A 14-year-old boy complaining of back pain. a) Right parasagittal STIR MR image shows a peri-isthmic area of marrow edema with no evidence of pars defect. b) Right para- sagittal T1-weighted MR image shows a breach of the low signal intensity of the bone cortex and also a linear area of decreased marrow signal propagating superiorly (arrow). The defect was judged incomplete but equivocal. c) Sagittal multiplanar reformatted CT image to the right of midline clearly demonstrates an incomplete fracture cleft at the base of the pedicle involving the inferior cortex (arrows) with intact superior cortex.
References: Leone A et al. (2011) Lumbar spondylolysis: a review. Skeletal Radiol 40:683–700.

 Right oblique radiograph of the lumbosacral spine shows narrow pars defect which appears as a radiolucent line around the “dog’s neck” (arrow). The edges appear jagged, and without much sclerosis. b, c) 37-year-old woman with chronic non-union of the pars of the L5 vertebra. Right oblique radiograph (b) shows spondylolysis of L5 (white arrow). Note gap as well as the smooth and rounded edges of the defect. Lateral view (c) shows L5-S1 spondylolisthesis (black arrows) and the wide osseous gap of the L5 pars (white arrow). References: Leone A et al. (2011) Lumbar spondylolysis: a review. Skeletal Radiol 40:683–700.")
 Anteroposterior radiograph shows the sclerosis projectively super imposed on the right pedicle of L5 (arrow). b) Reverse-angle transverse oblique CT scan through the pars of L5 shows left spondylolysis (black arrows) and better defines the extension of the reactive sclerosis of the contralateral neural arch (white arrow). References: Leone A et al. (2011) Lumbar spondylolysis: a review. Skeletal Radiol 40:683–700.")
 extension and b) flexion. Sagittal rotation, which corresponds to the variation of the angle between vertebral endplates adjacent to the disk, is measured by drawing perpendicular lines (solid white lines) to the vertebral bodies’ posterior walls (dotted white lines). If the apex of the angle is dorsal to vertebral body, the angle is positive; if it is ventral, the angle is negative.
Thus, in this case, the angle goes from negative to positive during flexion-extension. The sagittal rotation is the sum of the angles measured in flexion and extension. Note the narrow pars defects with irregular edges (arrowheads in a and b) and the minimal extension spondylolisthesis evident in (a) which becomes a more evident flexion spondylolisthesis in (b) (arrow). References: Leone A et al. (2011) Lumbar spondylolysis: a review. Skeletal Radiol 40:683–700.")
 in a 16-year-old boy suffering from low back pain. References: Institute of Radiology, Catholic University, School of Medicine, Rome/Italy.")
 Contiguous transverse CT images through the inferior portion of the L5 pedicles show the pars defects (arrows in a) which must not be mistaken for the facet joints, which are visible on a scan immediately below (arrows in b). A pars defect is more irregular with sinuous contours and irregular sclerotic margins. Note the widened sagittal diameter of the spinal canal. References: Leone A et al. (2011) Lumbar spondylolysis: a review. Skeletal Radiol 40:683–700.")
 Sagittal MPR CT image to the right of the midline and b) volume-rendered CT image clearly show complete fracture clefts with wide, smooth and rounded margins involving the right L4 (white arrow in a and b), and L5 (black arrow in a and b) pars interarticularis. The difference between pars defects and the facet joints is clearly demonstrated on the sagittal reformatted image (arrowheads in a). It is noteworthy that this patient also had left chronic non-union of pars defect at the L4 level. References: Leone A et al. (2011) Lumbar spondylolysis: a review. Skeletal Radiol 40:683–700.")
. The associated bony elements (*), which are represented by ossification of the ligamenta flava, narrow the transverse diameter of the spinal canal. The sagittal diameter of the spinal canal is widened. References: Leone A et al. (2011) Lumbar spondylolysis: a review. Skeletal Radiol 40:683–700.")
 Axial T1-weighted image through the L5 vertebral body shows the areas of decreased marrow signal (arrows) corresponding to sclerosis and the widened sagittal diameter of the spinal canal. b) Right parasagittal T1-weighted image confirms the spondylolysis (arrow) and shows encroachment of the neural foramen and entrapment of the L5 nerve root with near complete loss of the high-intensity foraminal perineural fat signal (arrowhead). References: Leone A et al. (2011) Lumbar spondylolysis: a review. Skeletal Radiol 40:683–700.")
 Transverse CT image through the pedicles of L5 clearly demonstrates complete pars defects (arrow). b) Corresponding fat saturated transverse T2-weighted image shows an abnormally high signal within the defect consistent with inflammatory tissue or fluid (arrow). References: Leone A et al. (2011) Lumbar spondylolysis: a review. Skeletal Radiol 40:683–700.")
 Sagittal T1-weighted MR image to the left of midline and b) corresponding gradient echo MR image show, respectively, intermediate signal intensity and increased signal intensity from the tissue that fills the pars defect (* in a and b) and extends into the neural canal with impingement of L5 nerve root (arrow in a), which is still surrounded by high-intensity fat signal. Note the interruption of the cortical margin and the normal marrow signal indicating a grade 4 spondylolysis. References: Leone A et al. (2011) Lumbar spondylolysis: a review. Skeletal Radiol 40:683–700.")
, tissue filling the defect (small black arrow) and disk material. Right L5 spondylolysis is also evident (white arrow). References: Leone A et al. (2011) Lumbar spondylolysis: a review. Skeletal Radiol 40:683–700.")
 Lumbar spondylolysis: a review. Skeletal Radiol 40:683–700.")
 Right parasagittal fat saturated T2-weighted MR image shows a peri-isthmic area of marrow edema at the L5 level with no evidence of pars defect (grade 1 spondylolysis) (arrows). b) Sagittal T1-weighted MR image performed six months later clearly depicts the intermediate signal intensity of the complete fracture cleft (arrow). References: Leone A et al. (2011) Lumbar spondylolysis: a review. Skeletal Radiol 40:683–700.")
 Right parasagittal STIR MR image shows a peri-isthmic area of marrow edema with no evidence of pars defect. b) Right para- sagittal T1-weighted MR image shows a breach of the low signal intensity of the bone cortex and also a linear area of decreased marrow signal propagating superiorly (arrow). The defect was judged incomplete but equivocal. c) Sagittal multiplanar reformatted CT image to the right of midline clearly demonstrates an incomplete fracture cleft at the base of the pedicle involving the inferior cortex (arrows) with intact superior cortex. References: Leone A et al. (2011) Lumbar spondylolysis: a review. Skeletal Radiol 40:683–700.")