2.
Basics of topographic functional anatomy: What is the symptom – where is the lesion?
A theoretical brain functional map allows the radiologist to plan the fMRI and interpret its results correctly.
Knowing the usual cortical localization of a function allows one to grossly locate a lesion on the brain by the symptoms it produces and vice versa.
Although the human brain can perform a wide variety of tasks,
in clinical practice we evaluate the most elemental forms of cortical activity: motor,
somatosensory,
verbal,
visual and auditory.
The description of the complex pathways involved in the different cortical functions is beyond the purpose of this poster and consequently we describe only the basic anatomic references needed to understand the test,
according to the Brain Atlas by Tamraz et al [2].
(FIGURES 1 – 3).
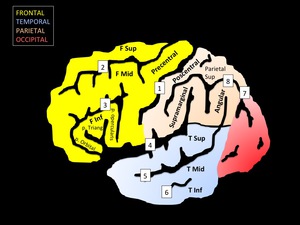
Fig. 1: Schematic representation of the surface anatomy of the brain from a lateral view.
Gyri nomenclature: F Sup: superior frontal; F Mid: middle frontal; F Inf: inferior frontal; p. Orbital: pars orbitalis of F Inf; p. Triang: pars triangularis of F Inf; p. opercularis: pars opercularis of F Inf; Parietal Sup: superior parietal; T Sup: Superior temporal; T Mid: middle temporal; T Inf: inferior temporal.
Fissure nomenclare: 1: central; 2: superior frontal; 3: inferior frontal; 4: Silvio; 5: superior temporal; 6: middle temporal; 7: parieto-occipital; 8: intraparietal.
- Primary motor and somatosensory cortex: located anterior and posterior to the central fissure,
respectively,
corresponding to the precentral and postcentral gyri.
According to the Penfield and Rasmussen (1959),
both have similar representation of the body,
corresponding to,
from inferior to superior,
the face,
hand-arm,
trunk and leg-foot.
- Supplementary motor area (SMA): located in the superior frontal gyrus mainly at its medial surface.
It is related to the trunk and proximal limb function and to the planning of motor movements.
The SMA is strongly connected to the contralateral SMA through the corpus callosum.
The most anterior part of the SMA is referred as the pre-SMA which is involved in linguistic planning.
- Premotor area (PMA): refers to an imprecisely defined area in the middle
frontal gyrus,
between the antero-inferior margin of the SMA and the precentral fissure.
It is related to the planning and organization of movement although it seems not to be essential for the function itself.
The expression “premotor cortex” often is used to group the SMA and the PMA.
- Anterior speech area (Broca’s): posterior segment of the inferior frontal gyrus,
formally composed by the pars triangularis (Brodmann area 45) and pars opercularis (Brodmann area 46).
Cranial connections of this area with the superior and middle frontal gyri (Brodmann area 6,
8 and 9) has been observed [3].
- Posterior speech area: comprises the posterior extent of the superior temporal gyrus,
mid and posterior thirds of the middle temporal gyrus (Wernicke’s).
In some subjects it can be suprasilvian or in the inferior parietal lobe,
corresponding to the supramarginal and angular gyri (Geschwin’s area) [4].
- Primary auditory cortex: represented by the Heschl’s gyri,
oriented perpendicularly to the superior temporal gyrus at its posterior portion,
protruding into the Silvian fissure.
Heschl’s gyri are variable in number,
frequently being dobled or tripled on the right temporal lobe.
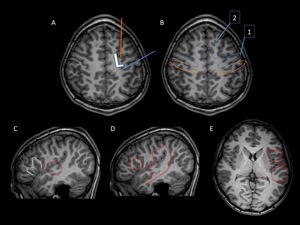
Fig. 2: Landmarks in surface anatomy of the brain. T1WI 3D images of a healthy patient.
A. Axial view. Superior frontal fissure (orange line) between the superior and middle frontal gyri. Central fissure (blue line) between the pre and postcentral gyri. Note that the superior frontal gyrus and the prefrontal gyrus converges in a L letter – like morphology.
B. Axial view. Blue ovals: 1: Primary motor area; 2: Supplementary motor area (SMA). Orange ovals: Primary somatosensory area
C. Sagittal view. . M-like morphology of the inferior frontal gyrus (white dotter line); Heschel’s gyrus in the superior temporal gyrus (red dotted circle), perpendicular to the orientation of the superior temporal gyrus.
D. Sagittal view. Red circle: Anterior speech area (Broca’s); Red box: Posterior speech area (Wernicke’s).
E. Axial view. Red circle: Anterior speech area (Broca’s); Red box: Posterior speech area (Wernicke’s and Geschwin’s).
- Striate visual cortex: corresponds to the upper and lower gyri adjacent to the calcarine fissure in the parasagittal aspect of the occipital lobe.
Comprises the cortex between the occipital pole and the parietooccipital fissure.
Is responsible for the visual perception.
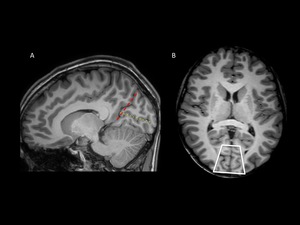
Fig. 3: Primary visual cortex. T1WI 3D MRI of a healthy patient.
Sagittal view at the midline. Red dashed line: parieto-occipital fissure; yellow dotted line: calcarine fisure. The primary visual cortex is the parenchima above and below the calcarine fissure.
Axial view. White box: Calcarine fissure and primary visual cortex.
3.
Principles of functional fMRI.
- The BOLD effect.
Functional MRI is based on the BOLD (Blood Oxygen Level Dependent) effect occurring during neuronal stimulation.
The nervous system is deeply related to the vascular system,
which can adapt to the brain’s need of oxygen and other substrates,
the so-called “neurovascular coupling”.
Thus,
neuronal activity produces an increase
in the tissue ́s oxygen demands,
which is supplied through neurovascular coupling,
in turn elevating the regional arterial blood flow for a period of seconds to maintain oxyhemoglobin levels higher than the deoxyhemoglobin ones,
leading to a net increase in oxyhemoglobin concentration or in other words,
a decrease in deoxyhemoglobin concentration.
The greater the area of cortical activation is,
the more the time it takes to the vascular system to adapt itself for supplying arterial blood flow to these activated areas [5].
Oxyhemoglobin doesn’t have special magnetic features compared to brain parenchyma or water.
On the other hand,
deoxyhemoglobin molecule have paramagnetic properties that makes it hypointense on T2* sequences of the MR,
that have high susceptibility to magnetic field inhomogeneities.
Thus,
during neuronal activity,
a slightly higher signal is detected selectively in the cortical area activated (oxygenated) because of a fast decay in the signal of the rest of the brain,
owing a higher concentration of deoxyhemoglobin [5].
(FIGURE 4). Therefore,
fMRI displays a vascular process as an indirect marker of brain activity,
which in turn can be a little imprecise.
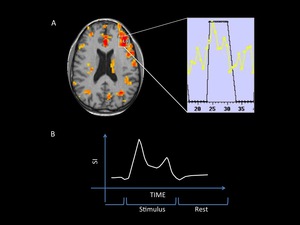
Fig. 4: Hemodynamic response to the stimulus.
A: MRI fused image shows inferior cortical activation. The analysis of a single voxel signal changes (BOLD effect) during the test is presented on a spectral map.
B: Simplified sprectral map. SI= signal intensity. During the repose block the signal intensity is low and increases during the stimulation block (see study protocol models in the text).
- Indications of fMRI.
The applications of this principle - depicting neuronal activity - are almost unlimited and are under continuous scientific investigation.
However,
in clinical practice the most extended indication is the presurgical mapping of the cortex in patients with brain tumors or vascular malformations located in eloquent areas and epilepsy refractory to the conventional treatment,
mainly on the temporal lobe.
There are three goals in the presurgical assessment: A) determine the risk of neurological deficit after the surgery; B) select patients for intraoperative mapping; and C) guide the surgery itself [6].
The fMRI mapping is important because,
even in healthy population,
the cortical representation of a function may vary and be different from the references previously described,
making the conventional MR incomplete in this regard.
On the other hand,
the effect of lesions in adjacent tissues can produce losing of anatomical landmarks or change the normal cortical distribution of functions [7,8] and has been observed that a distance on fMRI ≥10mm between the tumor and the functional cortex,
reduces the risk of postoperative loss of function [9].
Furthermore,
there could exist overlapping of a lesion with eloquent areas and a surgery plan should be made to perform the maximum-safe partial resection or a conservative treatment (i.e.: chemotherapy,
radiotherapy or gamma-knife ablation) [10].
In these latter cases,
intraoperative mapping is mandatory owing the slight imprecision of the fMRI.
Also,
fMRI sometimes demonstrates activations on areas related to but not absolutely necessary for a given task,
and could therefore be resected without significant sequels.
Intraoperative mapping permits discernment of which of these secondary areas are truly crucial for the task (5,9,10).
Particularly when assessing the language function,
an intraoperative electrocortical stimulation
has to be done but,
even in those cases fMRI is a valuable tool for planning the surgery and mapping eloquent areas because it can reduce the extent of the craniotomy and thus,
the duration of the intervention [11].
- Performing the study.
Image acquisition.
A common MR scanner is used to perform the study.
The patient is placed into the magnet camera and first,
a T1WI 3D whole brain scan is obtained,
which posteriorly will serve as an anatomical background to place functional images.
Then,
a repeatedly release of pre-defined stimuli,
known as paradigms,
is performed,
which can be visual,
motor,
sensitive,
auditory,
verbal or emotional,
among others,
in order to activate desired cortical regions.
Simultaneously,
MR images of the whole brain are acquired using fast sequences,
usually T2*,
and recorded as echo-planar images,
permitting fast whole brain scanning,
ranging depending on the equipment,
from less than a second and about 3 seconds [5].
The images obtained have lesser spatial contrast but also experience lesser movement artifacts in comparison with conventional diagnostic MRI.
Protocol models
Two different study models can be used.
The first and most common in clinical practice is known as block design,
in which a stimulus is presented while the patient is scanned (stimulus block) and then,
without stimulus,
the patient is re-scanned (inactivity block).
These blocks are repeated on average eight times,
which takes around 6 minutes [5].
The block design generates comparable data between active and inactive brain MR signal.
The second model is based on the event-related paradigms.
The concept of even- related paradigms has its origins in electrophysiological studies,
which have demonstrated cerebral electrical activity (potentials) in a known time lapse after the application of a determined stimulus.
In fMRI,
after releasing a stimulus of known potential response,
several MR scans are performed to show the brain BOLD effect- related changes during the time,
from repose to activation and de-activation.
An interesting model known as Resting State fMRI has increasingly gained attention in the research field.
The patient is scanned in resting state,
without any stimulation,
reducing the test duration.
The results don't depend on the adequate task performance by the patient side.
This model focus its attention on the changes in the BOLD signal related to certain diseases [12].
Paradigms
It’s important to use standardized paradigms,
adjustable to the patient’s abilities as well as training the patient to assure the correct perfomance of the task during the test.
A different activation pattern can be generated depending on the paradigm used.
Thus,
it is important to have a full understanding of each paradigm,
its indications and the activation patterns expected from its use.
Examples of some clinically useful paradigms are given as follows:
- Sensory-Motor area paradigms: finger tapping (ipsilateral to the lesion,
contralateral,
simultaneous bilateral,
alternating bilateral),
lip pouting or flexion/extension of the toes,
among others [6].
With patients under sedation,
who are unconscious or without voluntary motion of the upper limb - a passive hand sensory stimulation can produce supplementary motor activation [13].
(FIGURES 5 – 7).
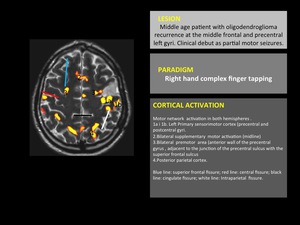
Fig. 5: Motor cortex fMRI. 1,5 Tesla Philips MR scanner and IViewBold software (p=0,05).
fMRI fused with T2WI structural image. Typical cortical activation pattern of complex finger opposition. In this patient there is a high surgical risk of motor function sequels owing the proximity of the tumor to eloquent areas.
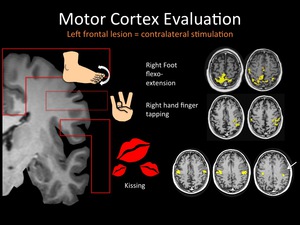
Fig. 6: Note the overlapping of the lip-tongue motor cortex and the tumoral lesion (arrow).
Other motor-related areas appear distant to the lesion, which implies less risk of postsurgical sequels.
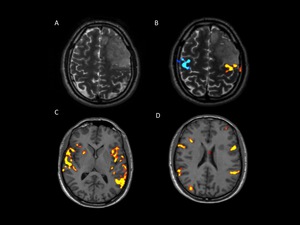
Fig. 7: Images of a young patient with a left frontal oligodentroglioma. A) T2WI conventional MRI shows a relatively hyperintense cortical lesion involving superior an middle frontal gyri and prefrontal gyrus. B, C and D fMRI. B) bilateral finger tapping activates both precentral gyri. Note the close contact between the lesion and the functional area, which implies surgical risk of postoperative sequels. C-D) the language paradigm activates bilaterally both anterior and posterior speech areas, with slight left dominance. A priori implies low risk of language sequels. red, poThe tumor was resected using Intraoperatory cortical stimulation tests (not shown) sparing the motor and language primary areas. Unless non significant sequels were registered, postoperative MRI showed little prefrontal residual tumor.
- Language paradigms: the aim of language tests is the preoperative definition of a) the hemispheric dominance,
b) the topographic localization of eloquent areas and c) the relationship of such areas with the lesion to treat [14].
The “Silent Word Generation” paradigm is used with the blocks model.
On the stimulation block the patient is asked to think of as many words as possible beginning with a letter,
related with an object or verb.
On the repose block a non-sense character is displayed and the patient is asked to look at it.
This paradigm depicts the lateral language dominance,
while demonstrating strong activation in the anterior and posterior speech areas [15].
“Auditory responsive naming task” [16] and reading texts versus non-linguistic symbols [17] can also be used to depict language lateralization,
particularly the anterior speech area. (FIGURES 8 – 9)
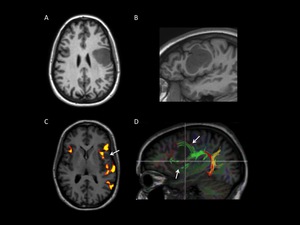
Fig. 8: A, B, C: language testing fMRI of a young patient with a left frontal tumor. D: DTI fiber tracking. A and B) axial and sagittal T1WI show an infiltrative hypointense mass involving the middle and inferior frontal gyri as well as the prefrontal gyrus. C) The unctional image shows left hemisphere language dominance. Broca’s and Wernicke’s areas are activated. No the close relation between the inferior margin of the lesion (arrow) and the Broca’s area, which represents high surgical risk. Intraoperative mapping is required. D) Note the splitting and displacement of the anterior fibers of the arcuate fasciculus due to tumoral compression - infiltration.
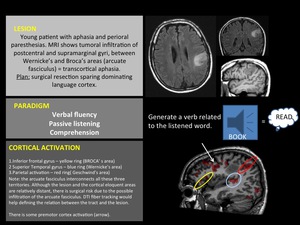
Fig. 9
- Auditory paradigms: passive listening of a speech via MR-compatible headphones can be used to depict and lateralize the temporal language function [18].
- Visual paradigms: in our institution we use a paradigm design similar to previously reported ones [19,20],
to depict the striate cortex.
On the stimulation block the patient is asked to look at a black and white checkered chart during 30 seconds; on the resting block the patient look at a black screen during 30 seconds.
Few repetitions (4 - 5) of each block are enough for demonstrating the striate cortex activation.
(FIGURE 10).
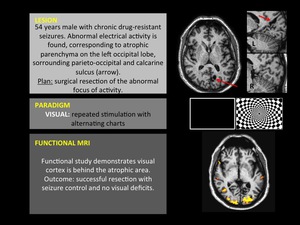
Fig. 10
The eccentric visual field can be assessed with the “Expanding Rings” paradigm,
which belongs to the event-related model.
The patient is presented with a checkered annulus image that progressively expands in a time-frame of 32 seconds.
The image is repeated 5 times per stimulus (run) and usually three runs are released.
The cortical activation occurs at different locations and varies with time.
On fMRI these activated areas are presented in a multicolor format,
distinguishing the central and various levels of peripheral visual field-asociated cortex [21].
Post processing
After recording the images a workstation receives the data,
apply technical corrections (slice-time,
motion,
spatial smoothing) and compares the signal of each image voxel with,
and without stimulation to decide whether or not there has been activation.
In making this decision,
the machine uses statistical analysis (i.e.: t student’s test,
correlation coefficient),
applying a significance threshold established by the radiologist (i.e.: p ≤0,05) and generates a parametric map.
The threshold can be readily modified to satisfy the desired sensitivity,
although with consequent higher or lesser “signal noise” - false positives [5].
Finally,
the functional images are fused with the anatomical T1WI 3D whole brain scan,
correlating the activated cortex with its location on the brain surface.
Sample cases are presented - correlating clinical,
anatomical and functional data (FIGURES 5 - 10).
Limiting factors of the fMRI.
Many authors have suggested several factors which reduce the BOLD effect including high grade gliomas,
advanced age [22],
intracranial pressure[23],
antiepileptic drugs[24],
and neurologic deficits [25].
Also,
a tumoral-related vascular steal can induce neurovascular uncoupling,
diminishing the BOLD effect,
this results in less false positives but added false negatives in comparison to intraoperative direct cortical stimulation (DCS) [25,26] .
Furthermore; fast-imaging lacks spatial resolution compared to conventional MRI,
and requires multiple scans of brain responses to gain sensibility owing the inaccuracy of the BOLD effect per se.
As previously mentioned,
fMRI is an indirect vascular marker of brain activity and as such,
depends on the nature of the vascular response,
implying some loss of temporal resolution [5].
Finally,
as with conventional MR studies,
movement of the patient will reduce the reliability of the test.
4.
Techniques related to the fMRI.
Diffusion Tensor Imaging (DTI) fiber tracking is a relatively new MR technique that demonstrates the orientation and integrity of the white matter tracts,
this includes corticospinal and corticobulbar tracts,
arcuate fasciculus,
corpus callosum and cerebellar peduncles among others [27,28].
DTI-FT is commonly performed after the fMRI in the same MR session.
In this way,
the fiber tract associated with a cortical activation can be demonstrated and thus,
corroborates its eloquent meaning instead of an artifact signal.
Thus,
knowing the distribution of the fiber tracts is an aim to interpret the cases in which an odd distribution of the cortical activation is observed,
for example,
language testing shows a great variation of cortical activation among subjects but the conjunction of activation and subcortical language tracts assures that the hypersignal doesn’t correspond to an artifact.
DTI also permits the assessment the effect of tumor or peritumoral edema in a specific tract [29].
(FIGURE 8).


 between the superior and middle frontal gyri. Central fissure (blue line) between the pre and postcentral gyri. Note that the superior frontal gyrus and the prefrontal gyrus converges in a L letter – like morphology.
B. Axial view. Blue ovals: 1: Primary motor area; 2: Supplementary motor area (SMA). Orange ovals: Primary somatosensory area
C. Sagittal view. . M-like morphology of the inferior frontal gyrus (white dotter line); Heschel’s gyrus in the superior temporal gyrus (red dotted circle), perpendicular to the orientation of the superior temporal gyrus.
D. Sagittal view. Red circle: Anterior speech area (Broca’s); Red box: Posterior speech area (Wernicke’s).
E. Axial view. Red circle: Anterior speech area (Broca’s); Red box: Posterior speech area (Wernicke’s and Geschwin’s).")

 during the test is presented on a spectral map.
B: Simplified sprectral map. SI= signal intensity. During the repose block the signal intensity is low and increases during the stimulation block (see study protocol models in the text).")
.
fMRI fused with T2WI structural image. Typical cortical activation pattern of complex finger opposition. In this patient there is a high surgical risk of motor function sequels owing the proximity of the tumor to eloquent areas.")
.
Other motor-related areas appear distant to the lesion, which implies less risk of postsurgical sequels.")
 T2WI conventional MRI shows a relatively hyperintense cortical lesion involving superior an middle frontal gyri and prefrontal gyrus. B, C and D fMRI. B) bilateral finger tapping activates both precentral gyri. Note the close contact between the lesion and the functional area, which implies surgical risk of postoperative sequels. C-D) the language paradigm activates bilaterally both anterior and posterior speech areas, with slight left dominance. A priori implies low risk of language sequels. red, poThe tumor was resected using Intraoperatory cortical stimulation tests (not shown) sparing the motor and language primary areas. Unless non significant sequels were registered, postoperative MRI showed little prefrontal residual tumor.")
 axial and sagittal T1WI show an infiltrative hypointense mass involving the middle and inferior frontal gyri as well as the prefrontal gyrus. C) The unctional image shows left hemisphere language dominance. Broca’s and Wernicke’s areas are activated. No the close relation between the inferior margin of the lesion (arrow) and the Broca’s area, which represents high surgical risk. Intraoperative mapping is required. D) Note the splitting and displacement of the anterior fibers of the arcuate fasciculus due to tumoral compression - infiltration.")

