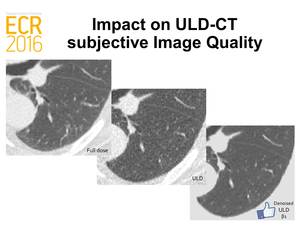
ECR 2016 / C-2126
Image-domain advance denoising of ultra-low-dose unenhanced chest CT: quantitative and qualitative evaluation on 25 normal examinations
This poster is published under an open license. Please read the disclaimer for further details.
Congress:
ECR 2016
Poster Number:
C-2126
Type:
Scientific Exhibit
Keywords:
Thorax, Computer applications, Radioprotection / Radiation dose, CT, Comparative studies, Computer Applications-Detection, diagnosis, Technology assessment, Image registration, Image verification
Authors:
M. Ohana1, A. Labani1, M.-Y. Jeung1, C. Ludes1, C. Roy1, C. Collet2, F. Heitz2, F. Rousseau2, V. Noblet2; 1Strasbourg/FR, 2Illkirch/FR
DOI:
10.1594/ecr2016/C-2126

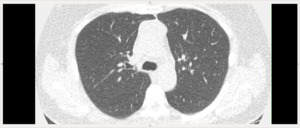
Fig. 3:
Original non-denoised ULD-CT image
")
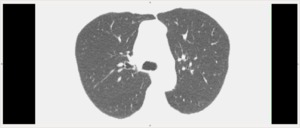
Fig. 4:
Optimal denoised ULD-CT image (β1.5, PSNR=6)
")
Fig. 5:
Insufficiently denoised ULD-CT image (β0.5, PSNR=4.2)
")
Fig. 6:
Overly denoised ULD-CT image (β10, PSNR=5.1)

Fig. 7:
Example 2