Diagnosis of MELAS syndrome is based on the demonstration of mitochondrial dysfunction and clinical symptoms.
Biochemical examination of blood and CSF shows high concentrations of lactate.
Genetic studies: mitochondrial DNA mutation A3243G (80% aprox) Fig. 1 .
Muscle biopsy: presence of ragged-red fibers which are characterized by abnormal proliferation of mitochondria Fig. 2 .
Neuroimaging studies (CT,
MRI,
MR spectroscopy):
The images used to illustrate the findings described below belong to two studies of two different patients with first degree consanguinity (mother and son) both with neurosensorial hearing loss,
history of muscle weakness and fatigue and acute neurological deficit episodes.
In both patients MELAS diagnosis was confirmed pathologically by muscle biopsy.
COMPUTED TOMOGRAPHY
The CT findings are nonspecific highlighting:
- Brain atrophy (greater than expected for the patient age).
- Basal ganglia calcifications.
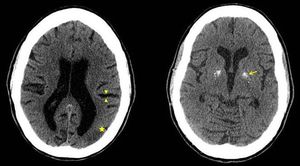
Fig. 3: Brain CT without contrast: prominent cerebral sulci (arrowhead), hypodens cortical parietooccipital areas(star) and gross calcifications in the basal ganglia (arrow).
- Areas of cortical low attenuation preferably in the parietal-occipital regions.
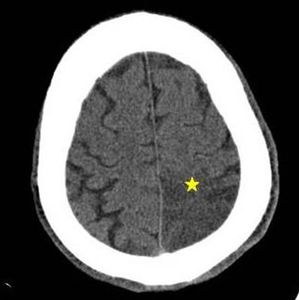
Fig. 4: Brain CT without contrast: left parietal cortico-subcortical hypodensity with sulci effacement (star).
MAGNETIC RESONANCE
Conventional MRI findings described in MELAS often consist of:
- T1-hypointense cortical thickening with no enhancement after paramagnetic contrast administration.
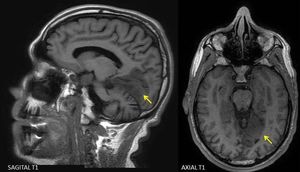
Fig. 5: Brain MRI - Sagittal and axial T1: left occipital hypointense cortical thickening (arrows)
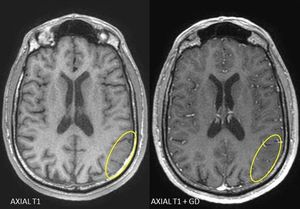
Fig. 6: Brain MRI - Axial T1 pre and postcontrast: left parieto-occipital corticosubcortical hypointensity that has no enhancement (ellipses)
- This cortical thickening is hyperintense on the DP,
T2 and FLAIR sequences predominantly in the parietal,
occipital and temporal lobes with lesser extent in the subcortical white matter.
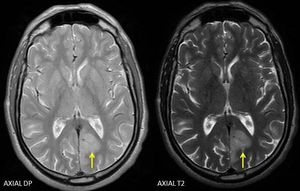
Fig. 7: Brain MRI - Axial DP and T2: hyperintense cortical thickening in the left occipital lobe (arrow)
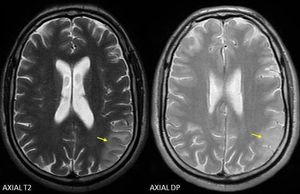
Fig. 8: Brain MRI - Axial T2: corticosubcortical left parietal hyperintensity (arrows).
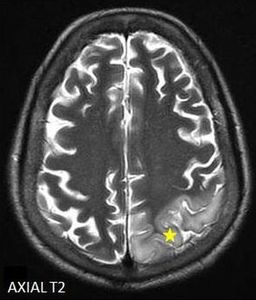
Fig. 9: Brain MRI - Axial T2: left parietal hyperintense cortical thickening (star)
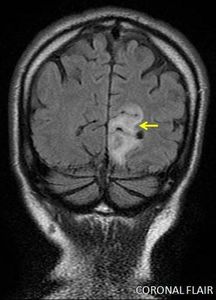
Fig. 10: Brain MRI - Coronal FLAIR: left occipital hyperintense cortical thickening (arrows).
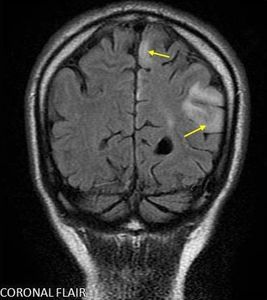
Fig. 11: Brain MRI - Coronal FLAIR: hyperintense cortical thickening with associated subcortical hyperintensity (arrows) in upper and supramarginal parietal gyrus.
These lesions do not follow a vascular distribution may affect different vascular territories simultaneously.
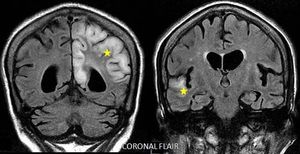
Fig. 12: Brain MRI - Coronal FLAIR: Extensive left parietal and right temporal hyperintense cortical thickening (star).
- DWI / ADC mixed behavior as described in stroke-like lesions: Restricted diffusion areas that correlate with increase and decrease ADC values in the acute phase.
This translates vasogenic edema and cytotoxic edema respectively ,
the latter similar to ischemic lesions.
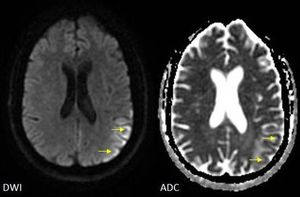
Fig. 13: Brain MRI - DWI / ADC: restricted diffusion of the left parietal affection with low ADC value (arrows).
Subcortical high ADC value without restricted diffusion due to T2 effect that translates edema of the subcortical white matter.
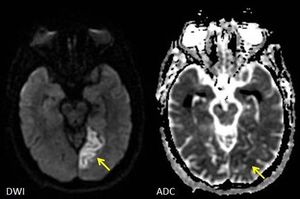
Fig. 14: Brain MRI - DWI / ADC: left occipital cortical thickening with restricted diffusion and low value of ADC (arrows)
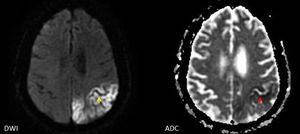
Fig. 15: Brain MRI - DWI/ADC: Restricted diffusion of the left parietal cortical thickening (yellow arrow) with low value of ADC (red arrow). There is no component of associated subcortical edema.
RM SPECTROSCOPY
MR spectroscopy stroke-like lesions shows:
- N-acetylaspartate (NAA) decrease: reflects neuronal loss or deterioration
- Lactate peak increase (TE = 35) reflects the presence of anaerobic metabolism,
even in apparently normal brain regions on MRI.
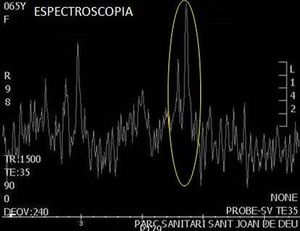
Fig. 16: Brain MRI spectroscopy (TE=35): A peak in the lactate metabolite (position 1.33). MR spectroscopy performed on the area of parietal involvement.
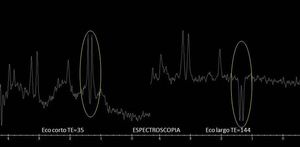
Fig. 17: Brain MRI spectroscopy : Peak in the lactate metabolite (position 1.33; TE= 35) is seen and is inverted in TE = 44.
MRI spectroscopy performed on affected parietal area.

 Screening for MELAS mutations in young patients with stroke of undetermined origin. Arq. Neuro-Psiquiatr. vol.65 no.2b")
 Screening for MELAS mutations in young patients with stroke of undetermined origin. Arq. Neuro-Psiquiatr. vol.65 no.2b")