I.
ANATOMY
The ST joint is a non-synovial articulation between two bony structures:
- the scapula; in particular the anterior concave surface
- the convex posterior aspect of the upper portion of the rib cage.
Two muscles are interposed between these osseous structures
- the subscapularis on the scapular side
- the serratus anterior on the thoracic side
And two synovial bursae assist the sliding movement:
- the subscapularis bursa: interposed between the subscapularis muscle and the serratus anterior muscle
- the scapulothoracic: between the serratus anterior and the rib cage
Two passive stabilisers:
- AC joint
- Coracoclavicular ligamentous complex (Trapezoid and coronoid ligaments)
There are four active stabilisers of the ST joint: serratus anterior,
rhomboid,
trapezius and levator scapulae.
The contraction of these muscles allows the scapula to move in 3 main directions on the thoracic wall:
- anterolateral sliding mediated by the serratus anterior
- posteromedial sliding (towards the spine) mediated by the trapezius (major and minor) and the rhomboid
- superior sliding mediated by the levator scapulae
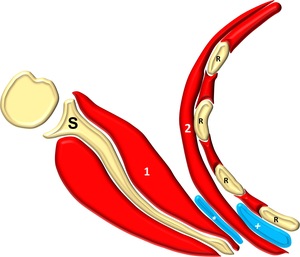
Fig. 1: Anatomy of the ST joint: scapula (S), ribs (R), subscapularis muscle (1), serratus anterior muscle (2), subscapularis bursa (*), scapulothoracic bursa (+)
References: Alessandro Vidoni
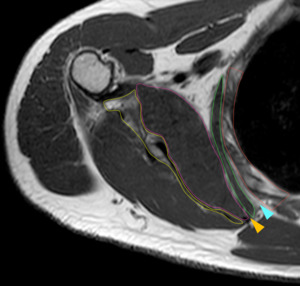
Fig. 2: MRI Anatomy on a T1 SE sequence: scapula (yellow line), chest wall (red line), subscapularis muscle (pink line) and serratus anterior muscle (green line); expected position of the subscapularis bursa (orange arrowhead), scapulothoracic bursa (skyblue arrowhead) are also indicated.
II.
MRI ACQUISITION PROTOCOL
MR imaging of this area is a clinical challenge,
in fact,
this is a large area quite far from the centre of the magnetic field and close to the lungs.
All these issues might cause different artefacts in particular:
- Movement artefact
- Suboptimal fat saturation
To minimise these artefacts which pose a significant challenge for high-quality diagnostic imaging we selected two sequences (full protocol in Table 1)
- T1 SE,
our anatomic sequence,
characterised by relatively fast acquisition time and at the same time by an accurate morphologic detail.
- T2 FS on the axial plane a fluid sensitive sequence that provides a good anatomic detail.
- STIR on the coronal plane to confirm the presence of fluid,
in fact this is the only fluid sensitive sequence not based on the chemical saturation of fat.
The best acquisition planes for imaging of this area are the axial and the coronal oblique oriented along the scapular long axis (Figure 3).
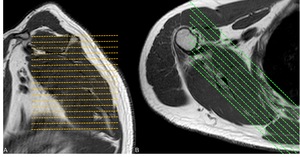
Fig. 3: Acquisition planes: axial (A) and coronal (B).
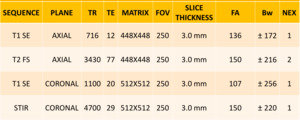
Table 1: MRI acquisition protocol.
III.
MRI FEATURES OF ELASTOFIBROMA DORSI
Elastofibroma dorsi (ED) is a slow growing,
uncapsuled,
fibroelastic pseudotumor with a prevalence of 2% in the population over 60 years old (F>M).
It is considered reactive to the chronic mechanical friction between the scapula and the chest wall.
ED is usually found in the infrascapular region deep to the serratus anterior muscle,
in 60% of the cases it is bilateral.
On clinical examination it is usually asymptomatic,
however,
approximately 50% of the patients refer moderate pain and clicking with movement.
On histologic examination it is characterised by:
-Fibrous tissue:
- Collagen bundles
- Elastic fibers
-Internal fatty streaks
On MR imaging ED is characterised by:
- Majority of the mass is isointense to muscle in T1W and T2W sequences (fibrous tissue)
- Interspersed areas of linear increased signal intensity both in T1W and T2W sequences,
that are suppressed with fluid sensitive sequences (adipose tissue)
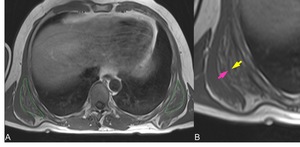
Fig. 4: Axial T1 SE A: Bilateral elastofibroma dorsi (green dashed lines), B: MRI appearance of the main components of the lesion, low signal intensity fibrous tissue (pink arrow) with interposed high signal intensity fatty streaks (yellow arrow).
IV.
MRI FEATURES SCAPULOTHORACIC BURSITIS
Scapulothoracic/subscapularis (ST/SubScap) bursitis is an inflammation of a bursa at the level of the ST joint.
Two synovial (scapulothoracic and subscapularis) as well as 4 adventitial bursae have been described.
ST/SubScap bursitis is an uncommon pathology which can be caused by:
-Tumors: scapular osteochondroma (solitary bone tumor which involves the scapula in 4% of the cases) is the most common cause
-Iatrogenic: post surgical changes
- Idiopathic (30%)
- Direct trauma
- Overuse: overhead athletes (throwing,
swimming,
tennis)
On clinical examination it is characterised by tenderness,
pain with increasing activity and palpable crepitius.
On histologic examination:
- Fluid filled lesion with synovial lining
On MR imaging it appears as a well demarcated mass containing material with a signal intensity equal to water (hyperintense with T2W/fluid sensitive sequences and hypointense with T1W sequences)
- ST bursitis: between the serratus anterior muscle and the rib cage
- SubScap bursitis: between the subscapularis muscle and the serratus anterior muscle
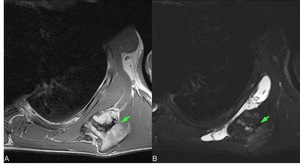
Fig. 5: Axial T1 SE (A), axial T2 FS (B) scapulothoracic bursitis secondary to osteochondroma arising from the scapula (green arrows).
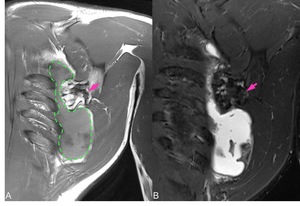
Fig. 6: Coronal T1 SE (A), coronal STIR (B): distention of the scapulothoracic bursa (green dashed line in A) secondary to osteochondroma arising from the scapula (pink arrows).
In one of our cases we observed a communication between the two synovial bursae (see Figure 6) and we think that including the two different pathologic entities in the general category of the “Scapulothoracic bursitis” might be appropriate.
However,
further histologic examinations would be useful to assess whether the communication is anatomic or secondary to pathology.
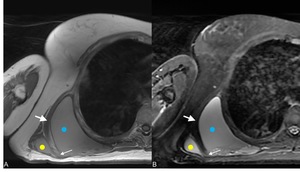
Fig. 7: Subscapularis and scapulothoracic bursitis T1 SE axial (A), T2 FS axial (B) the small arrow indicates the communication between the subscapularis bursa (yellow dot) and the scapulothoracic bursa (blue dot) the big arrow indicates the serratus anterior muscle, the anatomical landmark.
VI. MRI FEATURES THE MOST COMMON MIMIKERS
Lipoma represents the most common soft tissue neoplasm (approximately 50% of all soft tissue tumours) usually diagnosed between the 3rd and the 6th decades with no sex predilection.
L.
are divided into:
- Superficial: most common and easy to diagnose
- Deep
They can be found anywhere in the body and the most common locations of deep lipomas are:
- Lower extremity (45%)
- Trunk (17%)
- Shoulder (12%)
- Upper extremity (10%)
Usually,
with MRI it is easy to give a specific diagnosis and the presence of a fatty lesion is often suggestive of a lipoma.
In fact,
the estimated ratio lipoma/liposarcoma is 100/1 and the criteria for benignity are:
- dimension <10 cm
- the absence of thick irregular areas
- the absence of nodular non fatty areas
- >75% of adipose content
However,
the presence of masses bigger than 10 cm,
fat necrosis,
inflammation,
the presence of thick septa or calcifications are common findings and not necessarily indicative of malignant transformation.
In these cases,
the most appropriate definition is Atypical Lipomatous Tumours (ALT).
A patient with a lipoma in the ST region can present on clinical examination with pain and fatigability of the shoulder with an asymmetric scapular position.
On MR imaging a Lipoma usually shows signal intensity equal to adipose tissue (hyperintense in T1W and T2W sequences,
homogeneous suppression with fat saturated sequences); however,
sometimes,
septa or non fatty amorphous areas are present.
On histologic examination:
- lesion composed mainly of mature adipocytes
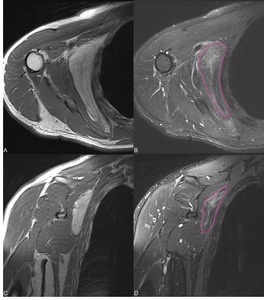
Fig. 8: Intramuscular ALT of the subscapularis T1 SE axial (A), T2 FS axial (B), T1 coronal (C), STIR coronal (D) this lesion is bigger than 10 cm and in fluid sensitive sequences (B,D) is showing areas of increased signal intensity (dashed lines in B and D) histology confirmed the benign nature.
Giant Cell Tumor (GCT) of bone is a generally benign tumor which accounts for 5% of all primary bone tumors and 20% of benign skeletal tumors.
It usually affects the age group between 20 and 50 with a slight female predilection.
GCT usually (75-90%) develops in long bones (distal femur>proximal tibia>radius) but in 15% of the cases can occur in flat bones,
with less than 1% in the scapula.
The most common features of this lesion are:
- Well defined but nonsclerotic margin
- Eccentric in location
- Extending near the articular surface
- Affects patients with closed physes
On histology :
- Mononuclear stromal cells
- Multinucleated giant cells that exhibit osteoclastic activity (characteristic feature)
On MRI it is characterised by intermediate-low signal intensity in T1W sequences and high signal intensity in T2W and fluid sensitive sequences.
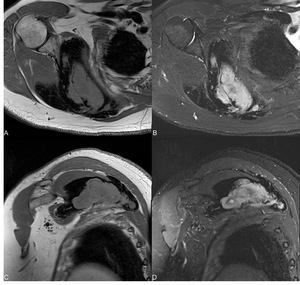
Fig. 9: GCT of the scapula involving the ST joinit: T1 SE axial (A), T2 FS axial (B), T1 coronal (C), STIR coronal (D).
Venous malformations are the most common peripheral vascular malformations,
which can involve head and neck (40%) trunk (20%) and limbs (40%).
They represent 2/3 of all vascular malformations and are defined as simple malformations with slow flow and abnormal venous network.
On clinical examination they enlarge with Valsalva maneuver and decompress with local compression.
On histologic examination they are composed by:
-Small and large dysplastic,
postcapillary,
thin-walled vascular channels with sparse smooth muscle and a variable content of:
- Hamartomatous stroma
- Thrombi
- Phleboliths
On MRI they are characterised by:
- Low signal intensity in T1W sequences
- High signal intensity in T2W and fluid sensitive sequences
The best clue for identification of a Venous Malformation is the presence of small voids of signal in all pulse sequences: phleboliths.
Fluid sensitive sequences are useful to define the topographic extent of the malformation.
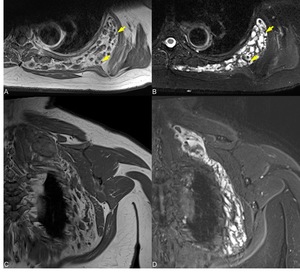
Fig. 10: Venous malformation in the ST joint T1 SE axial (A), T2 FS axial (B), T1 coronal (C), STIR coronal (D): yellow arrows in A and B indicate voids of signal, the diagnostic clue.
Schwannoma is a benign PNST (peripheral nerve sheet tumour) affecting patients in the 2nd and 3rd decades,
with no sex predilection; usually are solitary,
present slow growth and small (<5 cm).
Pain and neurological symptoms are present only in large tumours.
The histologic hallmark of a Schwannoma is the identification of:
- Antoni A and Antoni B regions
On MRI schwannoma appears as a low signal intensity mass in T1W sequences and as a high signal intensity mass,
with central low signal intensity (target sign) in T2w/fluid sensitive sequences.
For large lesions,
episodes of intralesional haemorrhage and cystic change are considered normal.
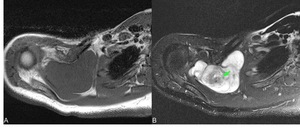
Fig. 11: Schwannoma involving the ST joint showing the typical appearance, low signal intensity in T1 SE axial (A) and high signal intensity in T2 FS axial (B) with a central area of low signal intensity (green arrow in B) representing the “target sign”.
The Intramuscular Myxoma is a lesion characterised by an abundant myxoid matrix and a paucity of spindle-shaped stromal cells.
Approximately 17% of the myxomas are intramuscular and can involve any muscle.
On MRI it appears as an ovoid-like lesion with fluidlike signal intensity (low in T1w sequences and high in T2W/fluid sensitive sequences) and 2 typical features:
- Fat rind visible on T1W sequences
- Increased signal in the adjacent muscle visible on T2W/fluid sensitive sequences
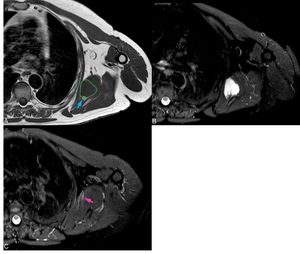
Fig. 12: Intramuscular myxoma of the subscapularis, axial T1 SE (A), axial T2 FS (B,C) typical MRI features: low T1 signal intensity (green dotted line in A) and fat rind (blue arrow in A), high signal in T2W signal (B), with increased signal of the adiacent muscle (pink arrow in C).
Fibromatosis (according to WHO classification Desmoid Type Fibromatosis) a benign fibroblastic tumor capable of local aggressive growth (it does not metastasize),
it occurs in patients usually between the 2nd and 4th decades and has a female predilection among younger patients.
The most common locations are: shoulder or upper arm (28%),
chest wall (17%), thigh (12%) and neck (8%).
On histologic examination it is composed by a variable amount of
- Collagenous stroma (main component)
- Spindle-shaped cells
- Areas of myxoid degeneration or hemorrage may be seen
On MRI the signal intensity is very variable due to the composition:
- Lesions with high collagen content and low cellular component show low signal intensity both in T1W sequences and T2W/fluid sensitive sequences
- Lesions with low collagen content and high cellular component show high signal intensity in T2W/fluid sensitive sequences (myxoid degeneration also contributes to elevation of T2 signal)
Three stages have been described:
- Cellular component is prominent
- Progressive ncrease of the collagen component
- Fibrous component is prominent
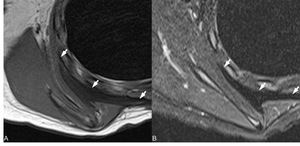
Fig. 13: Fibromatosis in the ST joint arrows indicate a low signal intensity lesion in both axial T1 SE (A) and T2 FS (B) indicating a mainly fibrous lesion with poor cellular content.
Extraskeletal Ewing’s sarcoma is a rare tumour,
the prevalence is between 15% and 20% of that of Ewing’s sarcoma of bone.
It usually affects patients in the first 3 decades of life.
Clinically it manifests as a large,
rapidly growing deep (92%) or superficial (8%) mass.
The most common locations are: paravertebral region (32%),
lower extremities (26%),
chest wall (18%),
retroperitoneum (11%),
pelvis and hip (11%),
upper extremity (3%).
On histology the main components are:
- Great amount of small blue cells
- Small amount of fibrous stroma
MRI features are not specific,
usually it is a soft tissue mass with heterogeneous signal intensity showing:
- Similar to the skeletal muscle in T1
- High signal intensity in T2
- Areas of haemorrhage characterized by fluid-fluid levels
- areas of necrosis
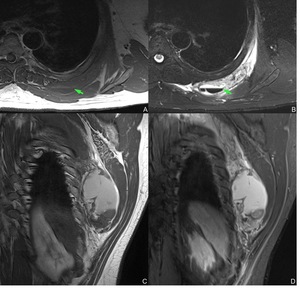
Fig. 14: Extraskeletal Ewing’s sarcoma T1 SE axial (A) T2 FS axial (B), T1 SE coronal(C) and STIR coronal (D): large soft tissue mass in the ST articulation, a haemorrhagic area with fluid-blood level is present (green arrow A and B).
