ECR 2017 / C-1673
Beyond muscle wasting: an easy approach with CT scan in differential diagnosis of muscle atrophy.
This poster is published under an open license. Please read the disclaimer for further details.
Congress:
ECR 2017
Poster Number:
C-1673
Type:
Educational Exhibit
Keywords:
Education and training, Education, CT, Musculoskeletal soft tissue
Authors:
J. A. GARAY MORA1, J. A. Gabutti1, A. Hernández Villegas1, J. I. Muñoz López1, B. Riveros Gilardi1, O. C. Rico Rodríguez1, M. A. Serrano2; 1Mexico City/MX, 2Mexico/MX
DOI:
10.1594/ecr2017/C-1673

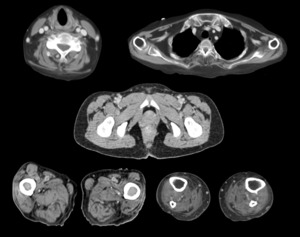
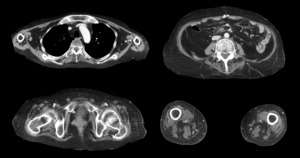
Fig. 1:
Computed tomography of the five standard levels in the musculoskeletal system.
, erector spinae (ES), posterolateral group (PL). References: Department of Radiology, Instituto Nacional de Ciencias Médicas y Nutrición Salvador Zubirán, Mexico City 2016")
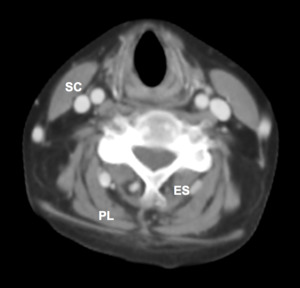
Fig. 2:
Sternocleidomastoid (SC), erector spinae (ES), posterolateral group (PL).
, subscapular (SS), infraspinatus (IS). References: Department of Radiology, Instituto Nacional de Ciencias Médicas y Nutrición Salvador Zubirán, Mexico City 2016")
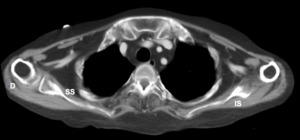
Fig. 3:
Deltoid (D), subscapular (SS), infraspinatus (IS).
, iliopsoas (IP). References: Department of Radiology, Instituto Nacional de Ciencias Médicas y Nutrición Salvador Zubirán, Mexico City 2016")
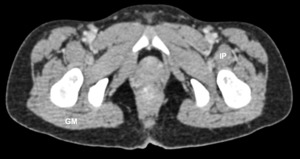
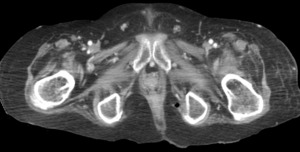
Fig. 4:
Gluteus maximus (GM), iliopsoas (IP).
, sartorius (8), gracilis, (G) biceps femoris (B). References: Department of Radiology, Instituto Nacional de Ciencias Médicas y Nutrición Salvador Zubirán, Mexico City 2016")
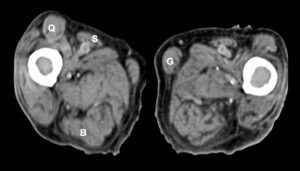
Fig. 5:
Quadriceps (Q), sartorius (8), gracilis, (G) biceps femoris (B).
, tibialis anterior (TA). References: Department of Radiology, Instituto Nacional de Ciencias Médicas y Nutrición Salvador Zubirán, Mexico City 2016")
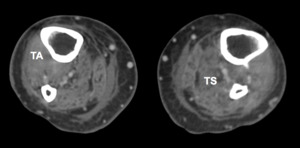
Fig. 6:
Triceps surae (TS), tibialis anterior (TA).

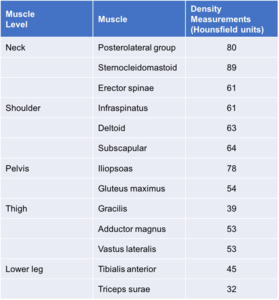
Table 1:
Mean density value in Hounsfield units of the normal muscles.
.
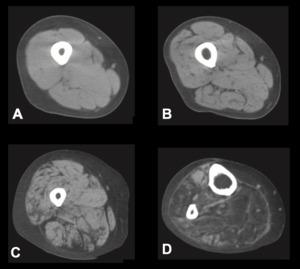
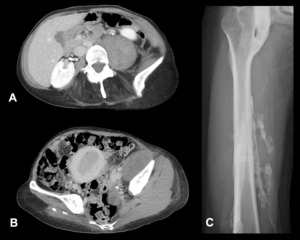
B. The image of the thigh shows abnormally clear delineation (grade 1).
C. The image of the thigh shows multiple patchy areas of low attenuation (grade 2).
D. The image of the lower leg demonstrates diffuse low attenuation in the ankle dorsiflexor and plantarflexor muscles (grade 3). References: Ohyama K. et al. European Journal of Neurology 2014, 21: 1002–1010")
Fig. 7:
Muscle CT of the lower extremities.
A. The muscle CT not reveal muscle...

Fig. 8:
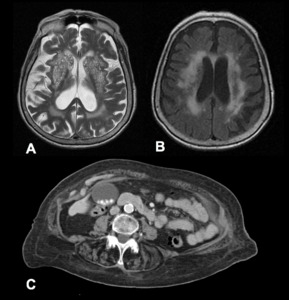
Patient with Binswanger's disease and prostration in bed.
A. Axial T2 MR shows...

Fig. 9:
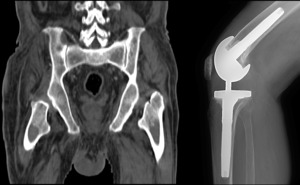
Patient with total right knee arthroplasty, coronal CT scan shows atrophy of...

Fig. 10:
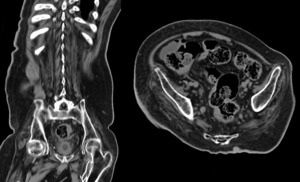
Coronal and axial CT of a patient with spinal cord injury, generalized muscle...

Fig. 11:
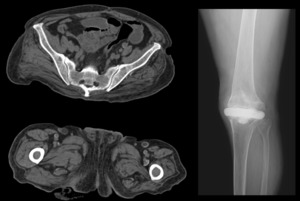
Patient with severe degenerative joint disease in knees, left knee spacer on...

Fig. 12:
Patient with Fibrodysplasia Ossificans Progressive.
A. Important fatty...

Fig. 13:
Patient with polymyositis, axial CT where atrophy of the proximal muscle groups...

Fig. 14:
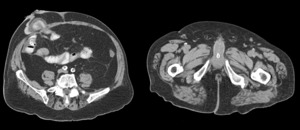
Patient with colon cancer post-surgery of right hemicolectomy with terminal...

Fig. 15:
Patient with AIDS and history of infection by Balamuthia, computed tomography...