Keywords:
Screening, Imaging sequences, MR, Neuroradiology brain, CNS, Segmentation, Dementia, Geriatrics
Authors:
E. Karavasilis1, T. Parthimos1, J. Papatriantafyllou1, F. Christidi1, S. Papageorgiou1, G. Kapsas2, A. Papanicolaou3, I. Seimenis2; 1ATHENS/GR, 2Alexandroupolis/GR, 3Memphis/US
DOI:
10.1594/ecr2018/C-1350
Methods and materials
Age- and gender-matched groups of 24 HC,
42 non-depressive AD patients,
29 depressive AD patients,
and 30 LLD patients were recruited from an outpatient Memory clinic and a Day Care Center for 3rd Age (Table 1) and underwent brain MRI with a 3D,
high-resolution (HR) T1-weighted sequence in different MRI scanners.
Inclusion criteria were: a) age ≥55 years old; b) diagnosis of unipolar depressive episode according to DSM-5 after semi-structural examination by a psychiatrist and c) diagnosis of AD according to well-established diagnostic criteria and guidelines [12-13]  and diagnosis of MCI and hippocampal atrophy indicative of an ongoing neurodegenerative process (as in AD) [12] ; score>17 on Mini-Mental State Examination (MMSE) to avoid false-positive/negative errors for the evaluation of the depression due to the underlying severe cognitive decline [13-14].
Exclusion criteria were: another major psychiatric illness; alcohol or drug dependence; previous history of other neurologic disease (other than dementia for patients); dementia (only for the LLD group); history of antidepressant treatment before the age of 55 years old; mental implants and claustrophobia precluding MRI; education <3 years and uncorrected sensory impairment precluding neurobehavioral examination.
All HC and clinical groups of LLD,
depressive AD and non-depressive AD patients were administered the Addenbrooke’s Cognitive Examination-Revised (ACE-R) [15] for the evaluation of cognitive status,
as well as the Geriatric Depression Scale (GDS) [16] for the evaluation of depressive symptoms.
On GDS scores range between 0-30; 0-9: normal; 10-19: mildly depressed; 20-30: severely depressed.
and diagnosis of MCI and hippocampal atrophy indicative of an ongoing neurodegenerative process (as in AD) [12] ; score>17 on Mini-Mental State Examination (MMSE) to avoid false-positive/negative errors for the evaluation of the depression due to the underlying severe cognitive decline [13-14].
Exclusion criteria were: another major psychiatric illness; alcohol or drug dependence; previous history of other neurologic disease (other than dementia for patients); dementia (only for the LLD group); history of antidepressant treatment before the age of 55 years old; mental implants and claustrophobia precluding MRI; education <3 years and uncorrected sensory impairment precluding neurobehavioral examination.
All HC and clinical groups of LLD,
depressive AD and non-depressive AD patients were administered the Addenbrooke’s Cognitive Examination-Revised (ACE-R) [15] for the evaluation of cognitive status,
as well as the Geriatric Depression Scale (GDS) [16] for the evaluation of depressive symptoms.
On GDS scores range between 0-30; 0-9: normal; 10-19: mildly depressed; 20-30: severely depressed.
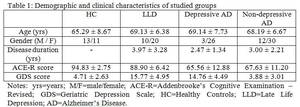
Table 1
Volumetric analysis was conducted using computational anatomy (CAT12),
a toolbox of statistical parametric mapping (SPM12; Wellcome Department of Cognitive Neurology,
www.fil.ion.ucl.ac.uk/spm/software/spm12) implemented on MATLAB R2015b (The MathWorks,
Natick,
USA).
All 3D-HR T1 images were first segmented into GM,
white matter (WM) and cerebrospinal fluid,
and then were normalized using Diffeomorphic Anatomical Registration Through Exponentiated Lie Algebra (DARTEL) using six iterations and an already existing DARTEL template in MNI space,
derived from 555 healthy controls of the IXI-database (http://www.brain-development.org).
Thus,
the creation of sample-specific DARTEL templates was not necessary.
During this registration pre-processing,
local GM and WM volumes are conserved by modulating the image intensity of each voxel by the Jacobian determinants of the computed deformation fields.
Registered image and preprocessing parameters exported were quantitatively assessed and data with weighted overall quality measure (IQR) lower than C+ were excluded from further analysis.
The remaining normalized and modulated GM images were smoothed with an 8 mm full-width-at-half-maximum isotropic Gaussian kernel via a standard module of SPM.
The pre-processed images were then entered into an ANOVA model in SPM12.
Between-group whole-brain differences (HC vs LLD; HC vs Depressive AD; HC vs Non-depressive AD; LLD vs Depressive AD; LLD vs Non-depressive AD; Depressive AD vs Non-depressive AD) on GM volume (GMV) were determined using post-hoc t-tests with age,
gender,
total intracranial volume (TIV) and MRI scanner,
as nuisance variables to account for any effect in the pattern of local GM changes.
The statistical threshold was initially set at p<0.05,
corrected for multiple comparisons with family-wise error (FWE) correction. The statistically significant clusters were labeled anatomically using the WFU_Pickatlas tool of SPM [17-18] and Automated Anatomical Labeling (AAL) [19].
