This poster will help in the understanding standard protocol,
the purpose of each sequence,
their mode of acquisition and how to interpret normal anatomy and pathology.
However,
in-depth quantum level knowledge of MRI is not necessary to image interpretation we will discuss the relevant principles for practical needs.
The poster is divided into main parts as
• Standard MRI abdomen pulse sequences
• New sequences
• Parameters of acquisition and trade-off
• Artifacts and interpret them
• Modifications of standard protocol
Standard MRI abdomen sequences
MRI liver
T1 weighted sequences
T1,
T2 weighted images are basic sequences in any MR protocol.
The basic physics behind these sequences are not hard to grasp.
Time to repeat (TR) and time to echo (TE) are the basic parameters in MR pulse sequences.
By changing these parameters (of course,
there are other many parameters),
the weightage of a sequence can be set to T1 or T2 weighting.
A short TR and short TE produce T1W and long TR and TE produce T2W images.
How to interpret:
Fat,
contrast,
protein,
hemorrhage and metals deposition are well picked up in T1 weighted images.
Pre-contrast T1 weighted images serve as a control for post-contrast images.
T2 weighted images
As mentioned T2 weighted images are produced when we set short TR and TE.
T2 weighted images can be acquired with or without fat saturation.
An easy way to identifying a T1 weighted image is to look for CSF in the spinal canal,
if it is dark and the subcutaneous fat is bright then the sequences are T1 and conversely,
if the CSF is bright then the sequence is T2 weighted.
HOLD ON,
fat is bright in FSE/TSE T2 weighted images,
due to something called J2 coupling.
Just remember fat is dark in conventional T2weighted images and bright on FSE/TSE T2 weighted images. Not to forget fat is dark in fat saturated sequences.

Fig. 1: T1 and T2 weighted images
How to interpret:
T2 weighted images are good for picking up pathologies as most of the pathological tissue are bright on T2.
Further T2 weighted images with fat suppression have higher sensitivity in detecting pathological conditions.
T1 in phase and out phases (dual echo)
The in-phase and out of phase images comes out from a single sequence.
The signals are acquired at different phases of when the phases of fat and water are in the same direction and in opposite direction.
These two set of images are usually interpreted in inter-correlation.
T1 in phase images appear similar to T1 weighted images.
Whereas out of phase images show dark signal in pixels containing both fat and water.
So these images are useful in evaluating the presence of microscopic fat in a tissue.
How to interpret:
In phase and out of phase images are read in conjugation to look for fat or iron.
The clinical examples are in evaluation of steatosis of the liver,
detection of fat in adrenal or renal adenomas.
Due to T2* susceptibility,
iron-containing tissues show low signal in ‘in phase’ images and high signal in ‘out of phase’ images.

Fig. 2: In phase and out of phase images
Diffusion-weighted imaging
Random movement of water molecules,
i.e.
diffusion is detectable on diffusion-weighted sequences.
A restricted movement of water molecules in edema (like in stroke),
high cellularity (like in lymphoma or malignancy) show hyperintensity while free fluid show normal signal return.
DWI is usually interpreted in combination ADC maps to confirm the restrictively and to look for something called T2 shine through.
How to interpret:
DWI has major application in the detection of early stroke,
detection,
and assessment of malignancy.
In liver MRI,
it is increasingly used to detect tiny metastatic lesions,
response assessment of tumors to therapy.
An area of restricted diffusion appears bright on DWI images and dark on ADC maps. T2 shine through appears bright on both DWI and ADC maps.

Fig. 4: Diffusion weighted image
References: Radiopedia
Contrast enhancing imaging
Commonly used contrast agents in MRI are gadolinium-based.
Gadolinium is a paramagnetic substance which appears bright on T1 weighted images.
At also shorten the TE which can be used in T2 based perfusion imaging.
How to interpret:
Assessment of arterial contrast enhancement is one of the impartment parts of the liver tumor diagnosis.
With the use of fast parallel imaging,
it is possible to obtain images of liver volume with a minute interval. The two main groups of commonly used liver contrast agents are extracellular and hepatobiliary gadolinium-based contrast agents.
The contrast agent is decided according to the assessment pathology of the liver.
Extracellular contrast agents are suited for assessment of washout of contrast in haemangiomas,
delayed contrast accumulation of cholangiocarcinoma.
Hepatobiliary contrast agents have a significant degree of hepatic uptake and biliary excretion.
These are well used in the assessment of primary liver lesion as well as small subcentimeter metastatic lesions.
The biliary excretion is taken advantage as delayed imaging to visualize contrast cholangiography.

Fig. 5: Contrast enhanced T1W image
References: Radiopedia
MRCP:
Magnetic resonance cholangiopancreatography (MRCP) is imaging of biliary tree and the pancreatic duct.
The sequences (heavily T2 weighted) are taken such a way that the bile and sections in the pancreatic duct appear bright with relative background tissue suppression.
The images are obtained in planar sections or volumetric acquisition with reformations.
MRCP is commonly used in the evaluation of calculi in the biliary tree,
post-surgical evaluation of anastomosis for leaks,
strictures,
congenital malformations of the biliary tree.
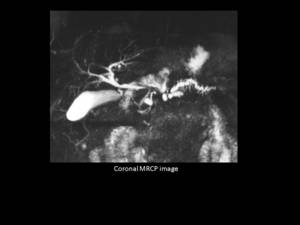
Fig. 3: MRCP
Contrast MRCP:
Delayed images of the upper abdomen after intravenous administration of hepatobiliary contrast agents show opacification of biliary tree with bilious excretion.
MRCP with secretin:
Secretin is a stimulant hormone for exocrine glands of the pancreas.
With the injection of secretin,
there is an increased release of pancreatic juice to the pancreatic duct thereby increase in the caliber of the pancreatic duct.
Secretin-stimulated MRCP is a dynamic evaluation of the pancreatic duct with improved visualization of the pancreatic duct and increasing the diagnostic value of MRCP.
MRI adrenals
The most common indication for MRI adrenals is to characterize adrenal nodules or masses and differentiate adenoma and metastasis.
Demonstration of fat within the adrenal nodules makes the diagnosis of adrenal adenoma.
In phase and out of phase images are useful in demonstrating microscopic fat.
In equivocal cases,
a contrast-enhanced MRI can help in further narrow down the diagnosis.

Fig. 6: In phase and out of phase images for an adrenal adenoma
References: Radiopedia
MRI enterography and enteroclysis
MR enterography is imaging of small bowel after oral administration of contrast agent.
Enteroclysis is imaging of small bowel after nasoenteric administration of contrast skipping the pylorus,
with better uniform and continuous luminal distension.
MRI enterography or enteroclysis are increasing used in imaging of Crohn's disease also in clinical scenarios where non-ionising imaging is preferred as in pregnancy and in pediatric patients.
MRI enterography
Negative or positive or biphasic contrast (bright on one sequence and dark on one sequence) is given per orally in large volumes before the start of the examination and patients are imaging after adequate distension of the bowel.
Antispasmodic agents are routinely used to reduce peristatic related image degradation. The abdomen is imaged with standard abdomen sequences along with rapid sequences like HASTE and SSFP sequences.
MRI enteroclysis
Here the contrast is administered via a nasoenteric tube which is inserted before the start of the examination.
While the patient is on the MRI gantry,
a handheld or MRI compatible automatic infusion device is used to administer the contrast.
Constant rate of contrast injection produced uniform distension of small bowel.
Images are acquired in different planes similar to enterography.
New sequences
Perfusion imaging
Perfusion imaging increasing used in oncology as assessment the tumor response to the chemotherapy,
especially in antiangiogenic drugs.
Perfusion imaging is a quantitative estimation of the intravenous contrast agent in intravascular and intracellular space with time.
The leakage of contrast to extracellular space is seen in angiogenesis which is often seen with malignancy.
It is imperative to note that the leakage of contrast is not equivalent to increased blood flow,
where there may be or may not be increased leakage of contrast.
MRI elastography
MRI elastography assesses the degree of stiffness of liver thereby,
fibrosis and cirrhosis.
The motion detecting phase contrast sequences are used to after a pulse of shear waves.
The stiffness of the liver can be plotted as a color map over the liver or it can be qualitatively estimated over a region of interest.
MRI quantification of fat and iron
Chemical shift imaging with proprietary imaging sequences of different vendors it is possible to quantify fat in the liver.
Hepatic fat quantification has shown promising results in accurate hepatic steatosis assessment.
Hepatic iron estimation takes advantage altered T2* relaxation time in presence of iron in tissues.
Parameters and trade-off
Well acquired MR images have a good signal,
less noise,
high special resolution acquired in a reasonable time.
These factors are very interrelated to each other.
The trade-off between is these factors are an essential part of image acquisition.
• Signal to noise ratio
• Contrast to noise ratio
• Spatial resolution
• Scan time
Further,
each factor is controlled by tuneable and not easily tuneable settings like
|
Signal to noise ratio
|
Spin echo or fast spin echo sequence
TR and TE time
Flip angle
Receiver coil
Matrix size
FOV
Slice thickness
Receiver bandwidth
Number of excitations and signal averaging (NEX/NSA)
|
|
Contrast to noise ratio
|
T1 T2 weightage of sequence
Contrast agent
Magnetisation transfer
Suppression of fat or water
|
|
Special resolution
|
Slice thickness
Matrix size
Size of FOV
Symmetry or asymmetry of FOV
|
|
Scanning time
|
TR time
Matrix size
Number of excitations and signal averaging (NEX/NSA)
|
Artifact reduction
Understanding an artifact is not only useful in eliminating the same,
as well as the intuition of their underlying mechanism,
can be useful in diagnosis.
Most common artifact encountered in any exam is motion related.
Involuntary motions which cannot be controlled can be tackled with strategies like fast imaging,
signal averaging and gated imaging.
Other techniques can be useful are the use of antispasmodic for peristalsis,
use of saturation bands for flow-related artifacts.
Another commonly used artifact is wrap-around.
When small FOV is used for the relative size of the abdomen the signal overlapping of similar phases produces this artifact.
This can be corrected by a larger field of view,
use of presaturation bands or using phase oversampling.
Field inhomogeneity or inhomogeneous fat saturation is usually due to metal or air foci which can be reduced with the use of other sequences or reduced TE.
Modifications of standard protocol
With the never-ending number of types of sequences available,
we can only practically use few in imaging of abdomen in view of time,
cost and patient comfort.
A protocol is a set of sequences set for a specific region and to look for a specific pathology.
A radiologist can change or make a modification of a protocol according to the clinical scenario.
For example,
if the patient under scanning is found to have an adrenal nodule,
a dual echo sequence can be added to characterize the nodule.
