Keywords:
Cancer, Computer Applications-Detection, diagnosis, MR, Neuroradiology brain, CNS, Artificial Intelligence
Authors:
M. D. Patel1, J. Zhan2, K. Natarajan1, R. Flintham3, N. Davies 3, P. Sanghera1, A. Peet1, V. Duddalwar4, V. Sawlani1; 1Birmingham/UK, 2Qingdao/CN, 3Birmingham /UK, 4Los Angeles/US
DOI:
10.26044/ecr2019/C-2003
Methods and materials
We retrospectively analysed 20 MRI studies of patients with biopsy-proven glioblastoma who had standard chemo-radiotherapy treatment and early progressive enhancing disease.
Studies were labelled as true progression (n=11) if there was progression or death within six months or pseudoprogression (n=9) if there was no further progression within six months.
The T1-weighted post-contrast and T2-weighted sequences were co-registered to allow segmentation of tumour components.
Enhancing disease and perilesional oedema were segmented from the two sequences respectively to create volumes of interest (Fig. 2) using ITK-SNAP open-source software4 with a semi-automatic method with manual adjustment.
Fig. 2: Co-registration of T1-weighted post-contrast and T2-weighted MRI images with segmentation of enhancing tumour (red) 
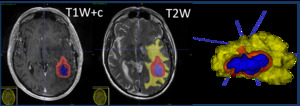
and peritumoural oedema (yellow). Volumes of interest created (right).
Radiomic texture features were extracted from the volumes of interest using CaPTk software5 and more than 280 features were extracted per MRI sequence.
The features included morphological,
grey level co-occurrence matrix (GLCM),
grey level run length matrix (GLRLM),
neighbouring grey tone difference matrix (NGTDM) and grey level size-zone matrix (GLSZM) features.
Statistical analysis was performed using SPSS software to calculate the differences between the true progression and pseudoprogression groups.