Role of the radiologist
- Detection and confirmation of the mass.
- Characterization (size,
location,
composition).
- Differentiate benign,
indeterminate or potentially malignant lesions (usually in 75% to 90% of cases)
- Determinate differential diagnoses.
- Performing biopsies guided by images.
- Staging and monitoring
GUIDELINES FOR DIAGNOSTIC. ACCORDING TO SIMPLES ALGORITMS AND SCHEMES
The first step is to evaluate the details of the clinical history necessary to rule out or increase the possibilities of differential diagnoses.
It is necessary to patients’ age,
lesion size,
location and multiplicity (Figures 3-7)
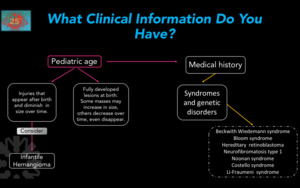
Fig. 3
Figure 3.
Orientation Scheme according to patient age.
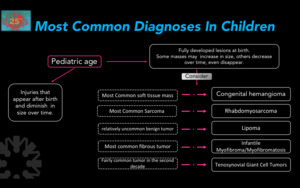
Fig. 4
Figure 4.
Most common histological diagnoses in children.
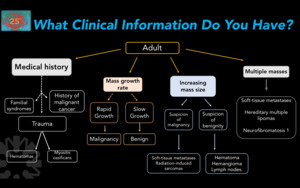
Fig. 5
Figure 5. Diagnostic approach according to clinical information in adults.
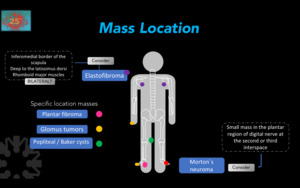
Fig. 6
Figure 6. Diagnostic approach according to mass location.
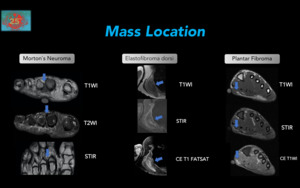
Fig. 7
Figure 7. Diagnostic approach according to mass location.Morton’s neuroma(left): Typical appearance of Morton´s neuroma,
with low signal intensity on T1WI,
intermediate signal intensity on T2WI,
located between the 2nd and 3rd metatarsal on the path of the plantar digital nerve. Elastofibroma dorsi: 60-yr-old female with a mass in the scapular region.
Irregular,
lenticular and heterogeneous mass,
with striae of fatty tissue and hypointense tissue in the T2WI sequences.
Contrast enhanced (CE) images demonstrated gadolinium enhancement (bottom),
of deep soft tissues of the latissimus dorsi muscle. Plantar Fibroma: Nodular thickening (which corresponds to the area of clinical interest (pain) with an external marker) in the middle third of the plantar fascia,
with signal intensity similar to muscle on T1WI (top),
higher than adjacent muscle on T2WI (middle),
and with gadolinium enhancement (bottom).
In addition to clinical information,
one should define the best imaging modality or complementary modalities according to the findings of the first studies (Figures 8-10).
In magnetic resonance,
a fundamental aspect,
are those characteristics that suggest that the evaluated mass has a high probability of malignancy and therefore a forceful recommendation should be given for the realization of a biopsy (Figure 11).
The evaluation of masses in magnetic resonance according to the behavior of these in T1WI or T2WI will always be an excellent strategy for the adequate approach of the masses in soft tissue (Figures 12-24)
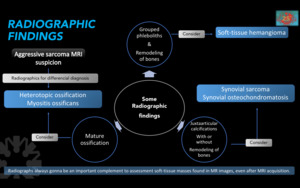
Fig. 8
Figure 8.Considerations according to the findings in simple radiography and use.
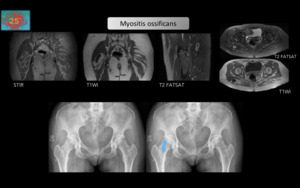
Fig. 9
Figure 9.Small fusiform solid mass,
within the fat of the right gluteus maximus muscle,
with heterogeneous signal with central calcification.
It is predominantly of low signal intensity on T1WI,
and shows peripheral increase in signal intensity on STIR and Fat Sat images. Plain Hip radiographs (bottom) confirms the calcified nature of the lesion,
highlighted in blue on the right image.
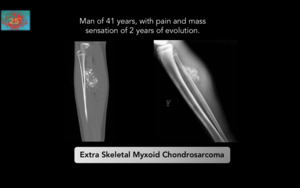
Fig. 10
Figure 10.Malignant tumor of the soft tissues characterized by a multinodular architecture,
abundant myxoid matrix and malignant cells with a chondroblastoid appearance.
They are located preferably in the deep planes of the proximal portions of the extremities and scapulohumeral and pelvic belts,
especially in the hip,
long survival with high recurrence rate.
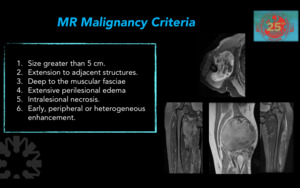
Fig. 11
Figure 11.Magnetic resonance malignancy criteria.
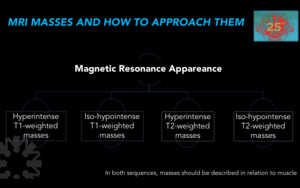
Fig. 12
Figure 12. Basic algorithm of masses appareance in Magnetic Resonance.
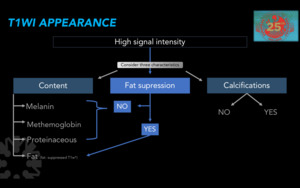
Fig. 13
Figure 13. Diagnostic approach according to MRI appearance on T1WI.
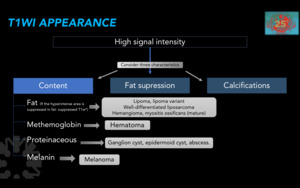
Fig. 14
Figure 14. Differential diagnoses according to MRI appearance on T1WI.
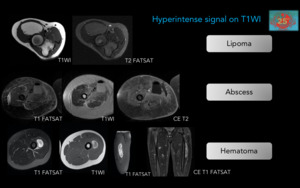
Fig. 15
Figure 15.Representative cases of hyperintense masses in T1WI.
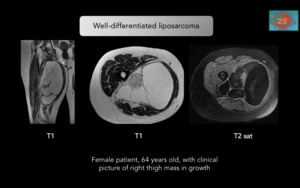
Fig. 16
Figure 16.
Representative cases of hyperintense masses in T1-weighted. Well-differentiated liposarcoma:Suspect when: Masses greater than 10 cm,
thick septa greater than 2 mm,
globular or nodular component that can be associated with liposarcoma.
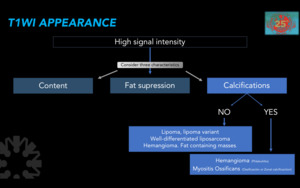
Fig. 17
Figure 17. Characteristics of hyperintense masses in sequences with T1 information.
Possible masses according to calcium content.
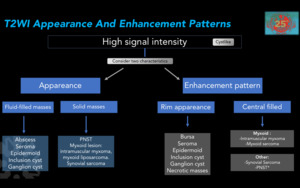
Fig. 18
Figure 18. Characteristics of hyperintense masses in sequences with T2 information.
*PNST: Peripheral nerve sheath tumor.
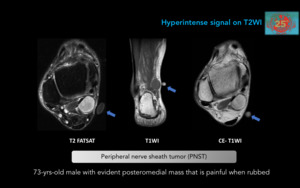
Fig. 19
Figure 19. Peripheral nerve sheath tumor (PNST).
Schwannomas and neurofibromas can be difficult to differentiate by imaging.
In MR,
they are fusiform masses isointense to the muscle on T1WI,
predominantly hyperintense on T2WI with a slightly hypointense central area and with diffuse enhancement.
A Vitamin D capsule has been used to mark the clinically evident mass.
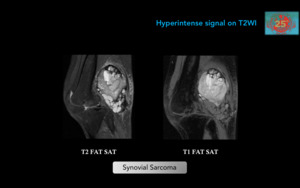
Fig. 20
Figure 20. Synovial Sarcoma.Malignant neoplasm seen in young adults (15 - 35 yrs-old).
It is not of synovial or intrarticular origin,
on the contrary it is from undifferentiated mesenchymal tissue.
The most frequent location in the lower extremities is in the popliteal region.
Intra-articular localization is infrequent (10%).
This popliteal fossa mass is heterogeneous,
with multiloculated solid,
cystic,
hemorrhagic,
and necrotic components.
T2WI shows perilesional edema.
No fatty contents are depicted.
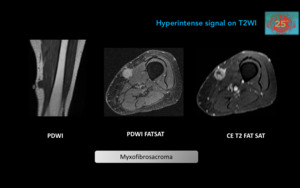
Fig. 21
Figure 21. Myxofibrosarcoma: Malignant tumor of fibroblastic origin,
previously known as malignant fibrous histiocytoma.
Typical for people over 66-yrs-old.
Masses are predominantly subcutaneous (high grade tumors are deeper),
with non-specific low signal on T1WI sequences and high signal on T2WI,
and with periferical enhancement.
Differential diagnoses include epithelioid fibrosarcoma and low-grade fibromyxoid sarcoma.
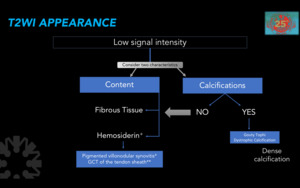
Fig. 22
Figure 22. Diagnostic approach according to MRI appearance on T2WI.
*Hematomas and hemangiomas are usually inhomogeneous but not as a uniformly low-mass on T2WI.
**Giant cells tumor or the tendon sheath.
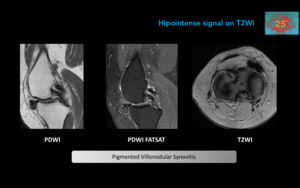
Fig. 23
Figure 23. Pigmented Villonodular Synovitis: Synovial proliferation and hemosiderin deposits.
Present in the 2nd and 5th decades,
usually affects the knee.
MR demonstrates the lobulated lesions of heterogeneous signal intensity.
Gradient echo sequences show markedly hypointense foci due to the presence of hemosiderin.
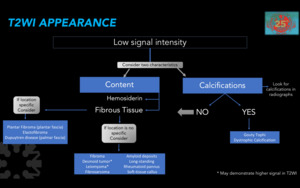
Fig. 24
Figure 24. Diagnostic approach according to MRI appearance on T2WI.
CHECK LIST
We have designed a checklist to consider when reviewing soft tissue masses,
independent of the imaging modality,
with emphasis on MR imaging.
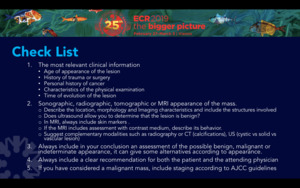
Fig. 25
