ECR 2019 / C-2196
Role of Baseline Spectroscopy and ADC Biomarkers as Early Recurrence Predictors in Patients with Glioblastoma.
Congress:
ECR 2019
Poster Number:
C-2196
Type:
Scientific Exhibit
Keywords:
Neuroradiology brain, MR, MR-Spectroscopy, MR-Diffusion/Perfusion, Diagnostic procedure, Intensity Modulated Radiotherapy (IMRT), Treatment effects, Outcomes, Cancer, Multidisciplinary cancer care
Authors:
N. Dichko1, Y. Kmetyuk2, K. A. Musaieva2, O. Silaieva2; 1Kyiv/UA, 2Kiev/UA
DOI:
10.26044/ecr2019/C-2196

Fig. 6:
Table 1. Basic characteristics of the study cohort.

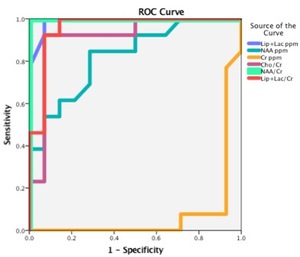
Fig. 7:
Table 2. Cut-off values of most important MRS parameters for prediction of...

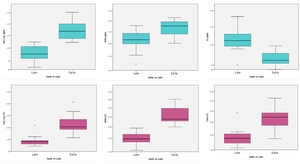
Fig. 8:
Table 3. The mean and range of MRS, DWI, CE and structural parameters and...